. 2007 Apr 18;27(16):4472-81.
doi: 10.1523/JNEUROSCI.5368-06.2007.

AKAP12 regulates human blood-retinal barrier formation by downregulation of hypoxia-inducible factor-1alpha

Affiliations

AKAP12 regulates human blood-retinal barrier formation by downregulation of hypoxia-inducible factor-1alpha

Yoon Kyung Choi et al. J Neurosci. .

Abstract

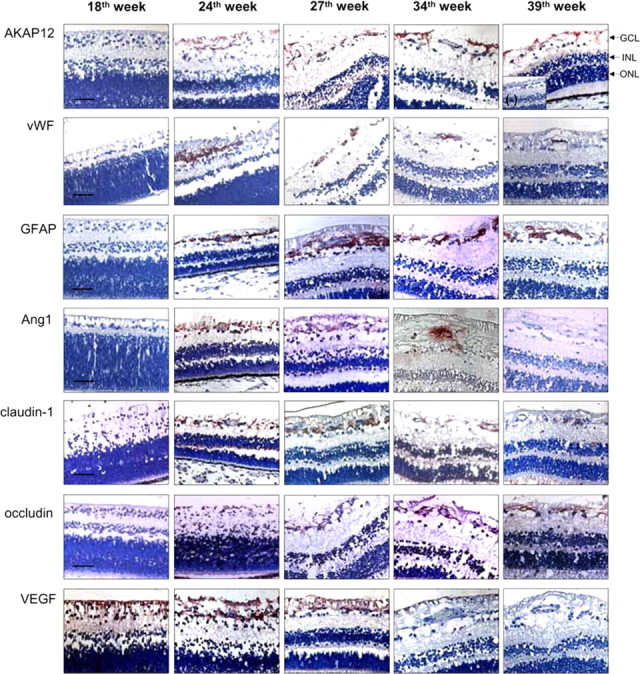
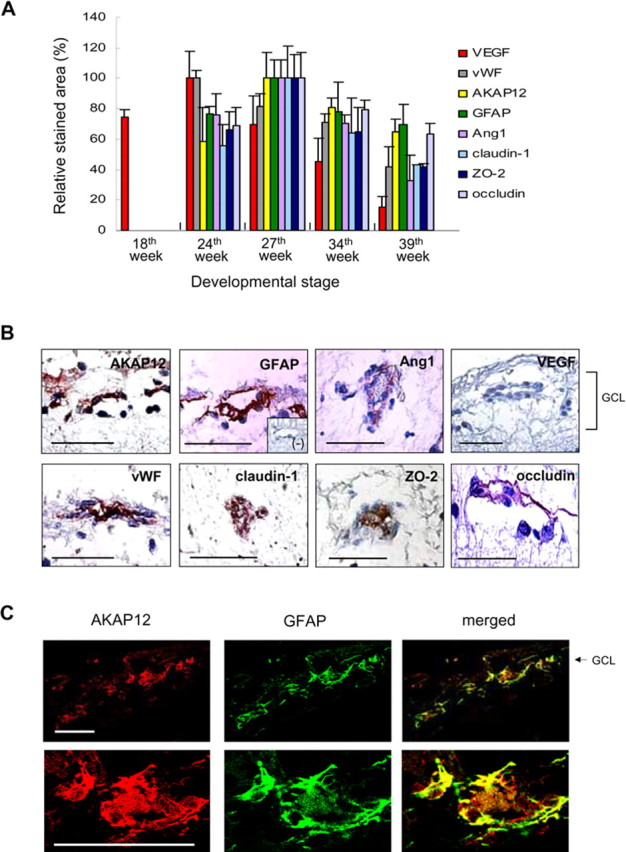
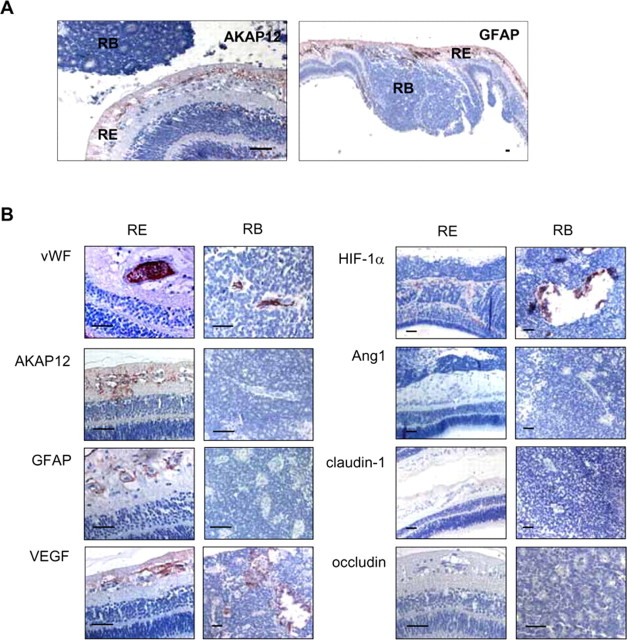
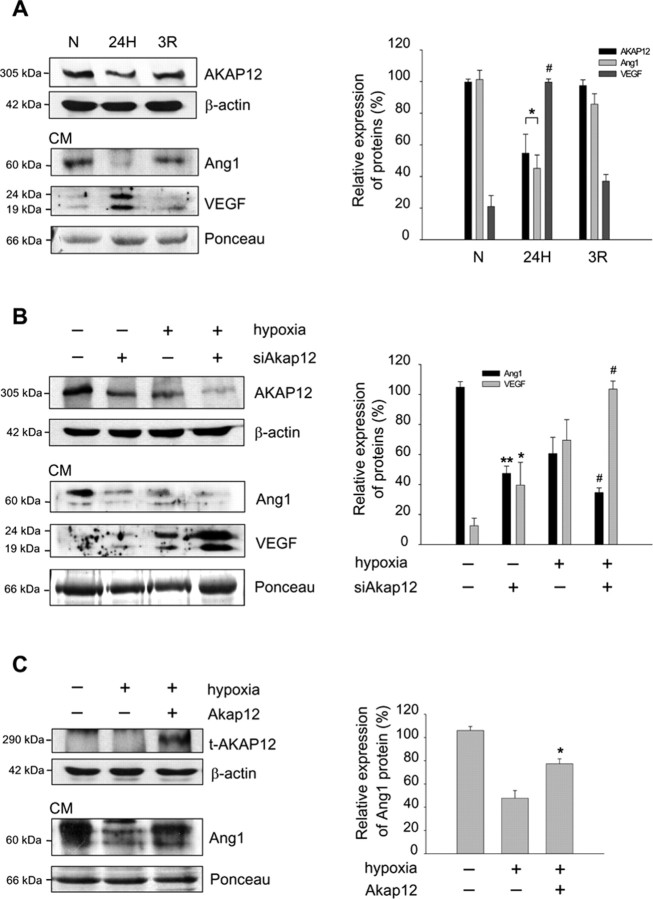
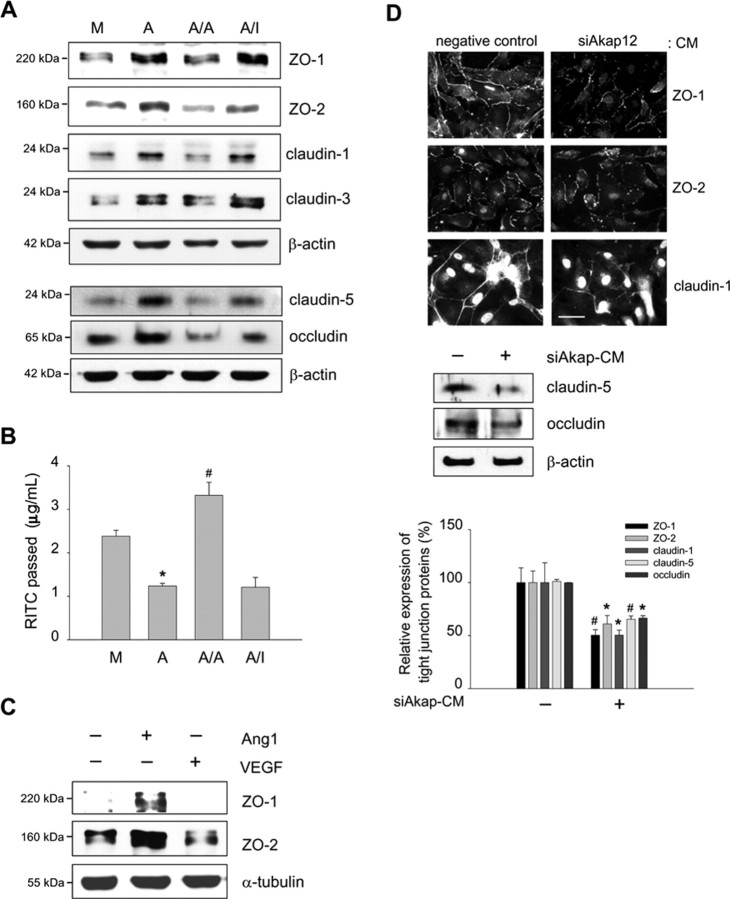
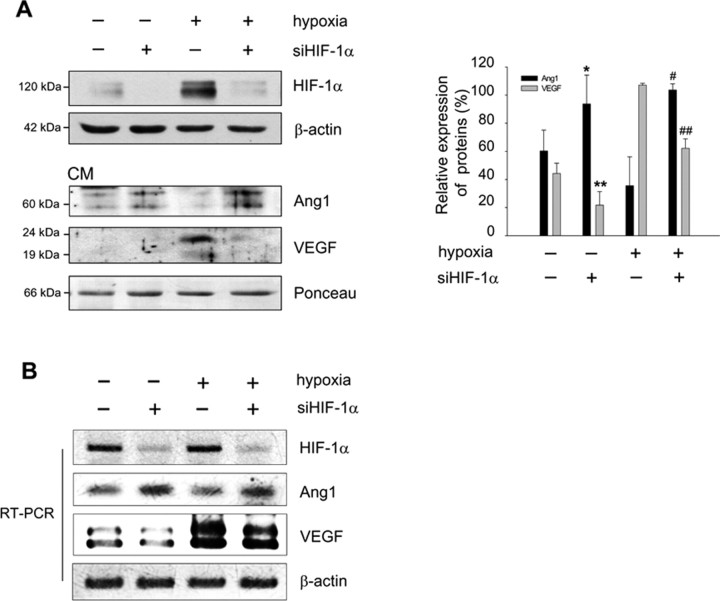
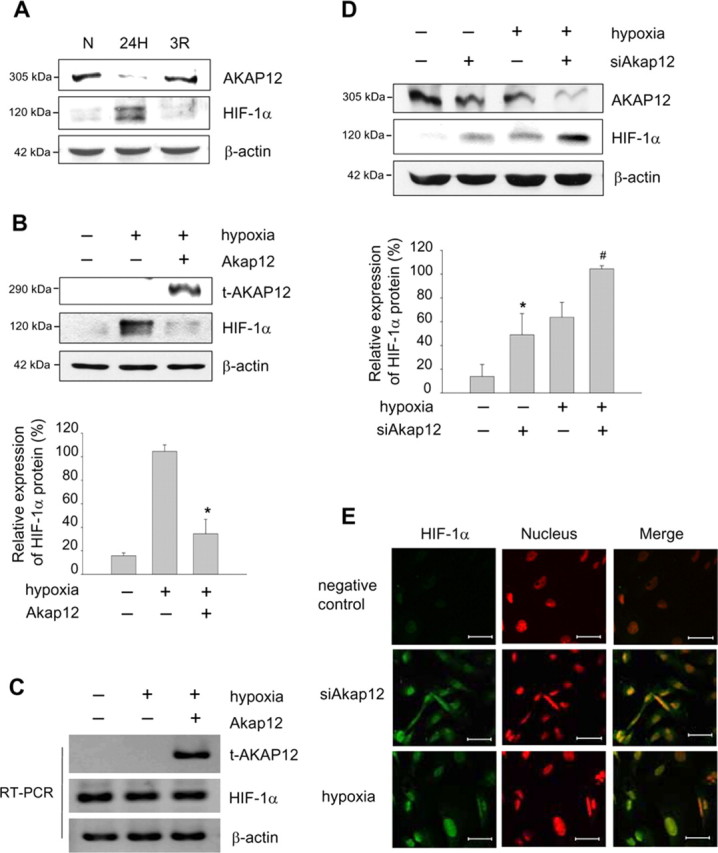
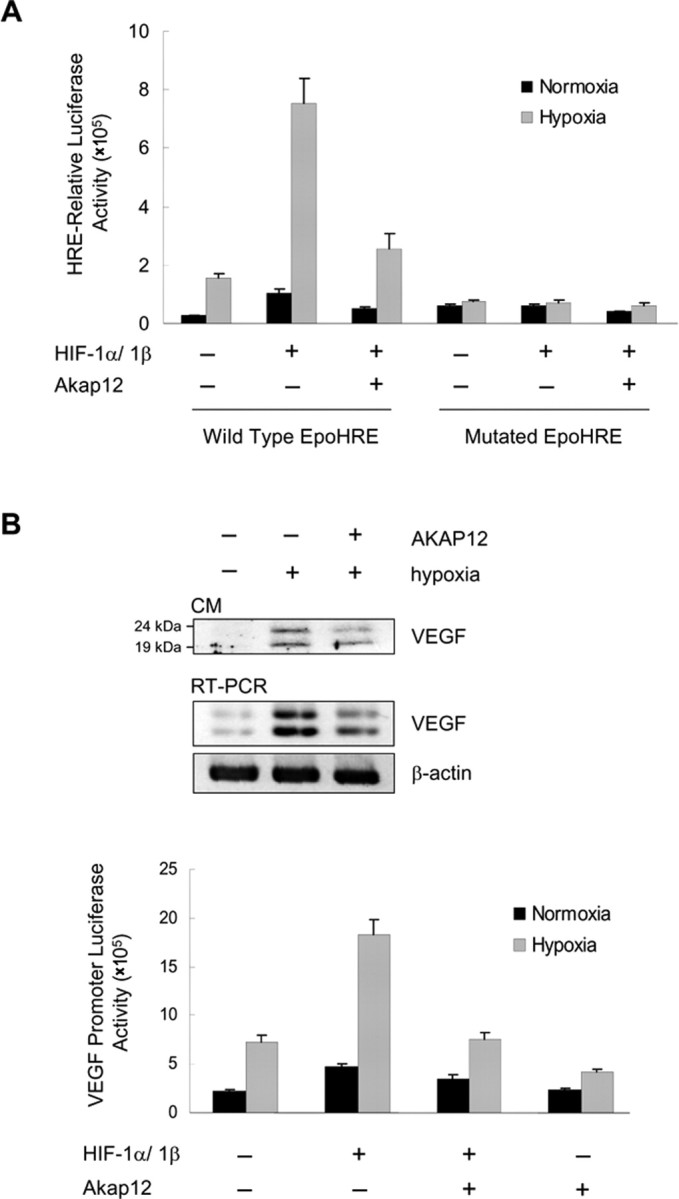
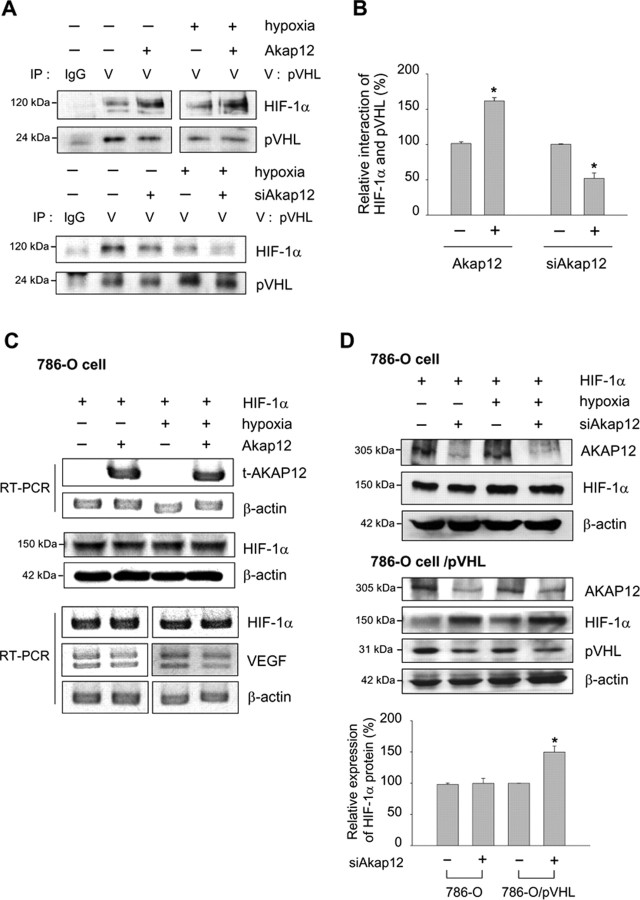
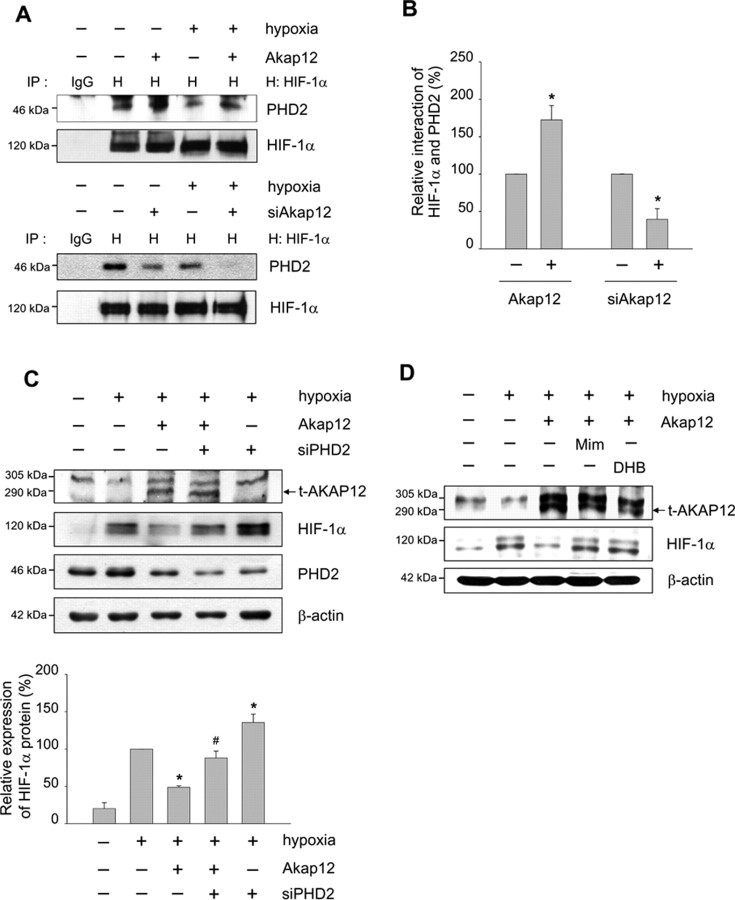
Many diseases of the eye such as retinoblastoma, diabetic retinopathy, and retinopathy of prematurity are associated with blood-retinal barrier (BRB) dysfunction. Identifying the factors that contribute to BRB formation during human eye development and maintenance could provide insights into such diseases. Here we show that A-kinase anchor protein 12 (AKAP12) induces BRB formation by increasing angiopoietin-1 and decreasing vascular endothelial growth factor (VEGF) levels in astrocytes. We reveal that AKAP12 downregulates the level of hypoxia-inducible factor-1alpha (HIF-1alpha) protein by enhancing the interaction of HIF-1alpha with pVHL (von Hippel-Lindau tumor suppressor protein) and PHD2 (prolyl hydroxylase 2). Conditioned media from AKAP12-overexpressing astrocytes induced barriergenesis by upregulating the expression of tight junction proteins in human retina microvascular endothelial cells (HRMECs). Compared with the retina during BRB maturation, AKAP12 expression in retinoblastoma patient tissue was markedly reduced whereas that of VEGF was increased. These findings suggest that AKAP12 may induce BRB formation through antiangiogenesis and barriergenesis in the developing human eye and that defects in this mechanism can lead to a loss of tight junction proteins and contribute to the development of retinal pathologies such as retinoblastoma.


Figures

Figure 1.
Figure 1.
Immunohistochemical analysis of AKAP12, vWF, GFAP, Ang1, VEGF, and tight junction proteins in the developing human retina. Human fetal retinal sections were immunostained with antibodies to AKAP12, vWF, GFAP, Ang1, claudin-1, occludin, and VEGF (red). Nuclei were counterstained with hematoxylin and are seen in blue. The negative control was immunostained with normal rabbit IgG. GCL, ganglion cell layer; INL, inner nuclear layer; ONL, outer nuclear layer. Scale bar, 50 μm.
Figure 2.
Figure 2.
Immunohistochemical analysis in the developing human retina. A, Immunoreactivity of the indicated factors was quantified using Image-Pro Plus and is presented relative to the area with the highest staining intensity at 27 weeks (AKAP12, GFAP, Ang1, claudin-1, ZO-2, and occludin) or at 24 weeks (VEGF and vWF). At least three different tissues were used for each stage from 18 to 40 weeks. B, Immunohistochemical analysis of the expression of AKAP12, GFAP, Ang1, VEGF, vWF, and the tight junction proteins claudin-1, ZO-2, and occludin. The negative control was immunostained with normal rabbit IgG. C, Double immunofluorescence staining for AKAP12 (red) and GFAP (green) at 34 weeks of fetal retinal tissue. Colocalization of the two proteins is seen as yellow fluorescence. Scale bars, 50 μm.
Figure 3.
Figure 3.
Immunohistochemical analysis in the retinoblastoma tissues. A, Immunohistochemical analysis of AKAP12 and GFAP in retinoblastoma tissue. Retina (RE), Area of the retina outside of the tumor; retinoblastoma (RB), tumor region. B, Immunohistochemical analysis of vWF, AKAP12, GFAP, VEGF, HIF-1α, Ang1, claudin-1, and occludin expression in the RE (left) and RB (right) of retinoblastoma tissues. Scale bars, 50 μm.
Figure 4.
Figure 4.
AKAP12 differentially regulates the expression of Ang1 and VEGF. A, Human astrocytes were exposed to normoxia (N), 24 h of hypoxia (24H), or 24 h of hypoxia followed by 3 h of reoxygenation (3R). AKAP12 in cell lysates and Ang1 and VEGF in CM were analyzed by Western blot under the indicated levels of oxygen tension. The quantification of the immunoblot from three independent experiments is shown on the right. The expression of AKAP12 and Ang1 under normoxia was set to 100% and the VEGF expression under hypoxia was set to 100%. *p < 0.05 compared with normoxic and reoxygenation conditions; #p < 0.01 compared with normoxic and reoxygenation conditions. B, Human astrocytes were transfected with siAkap12, incubated for 12 h, and then exposed to 24 h of normoxia or hypoxia. The quantification of the immunoblot from four independent experiments is shown on the right. Ang1 expression was set to 100% in the control under normoxia, and VEGF expression was set to 100% in siAkap12-transfected hypoxic condition. **p < 0.001 compared with control in normoxic condition; *p < 0.05 compared with control in normoxic condition; #p < 0.05 compared with control in hypoxic condition. C, Rat Akap12 was transfected into human astrocytes, incubated for 12 h, then exposed to 24 h of normoxia or hypoxia. Levels of transfected AKAP12 protein (t-AKAP12) in whole-cell lysate and Ang1 in CM were analyzed by Western blot. The quantification of the immunoblot from three independent experiments is shown on the right. The expression under normoxia was set to 100%. *p < 0.05 compared with mock-transfected control in hypoxic condition. β-actin and Ponceau red staining served as the controls for total protein levels.
Figure 5.
Figure 5.
AKAP12 regulates the expression of tight junction proteins, which is mediated by Ang1. A, Expression of ZO-1, ZO-2, claudin-1, claudin-3, claudin-5, and occludin in HRMECs treated with CM from Akap12-transfected astrocytes was analyzed by Western blot. M, Mock-CM; A, AKAP12-CM; A/A, AKAP12-CM pretreated with anti-Ang1 antibody; A/I, AKAP12-CM pretreated with control IgG. Representative Western blots are shown (n = 3). B, RITC-dextran passage was analyzed for vascular permeability in HRMECs at the same conditions as in A. *p < 0.01 compared with mock-CM; #p < 0.01 compared with AKAP12-CM. C, Expression of ZO-1 and ZO-2 in HRMECs treated with 10 ng/ml VEGF165 and 100 ng/ml COMP-Ang1 for 6 h was analyzed by Western blot (n = 3). D, Top, Expression of ZO-1, ZO-2, and claudin-1 in HRMECs treated with negative control or siAkap12-transfected CM (siAkap-CM) from astrocytes was analyzed by immunofluorescence staining. Middle, The expression of claudin-5 and occludin was analyzed by Western blot. Bottom, The quantification of the intensity from three independent experiments is shown. The expression was set to 100% in CM from negative control-transfected astrocytes. *p < 0.05 compared with control; #p < 0.001 compared with control. Scale bar, 50 μm.
Figure 6.
Figure 6.
HIF-1α is involved in the regulation of Ang1 expression. A, Human astrocytes were transfected with siHIF-1α, incubated for 12 h, then exposed to 24 h of normoxia or hypoxia. HIF-1α in cell lysates, and Ang1 and VEGF in CM were analyzed by Western blot. The quantification of the immunoblot from three independent experiments is shown on the right. Ang1 expression was set to 100% in siHIF-1α-transfected hypoxic condition, and VEGF expression was set to 100% in the control under hypoxia. *p < 0.05 compared with control in normoxia; **p < 0.01 compared with control in normoxia; #p < 0.05 compared with control in hypoxia; ##p < 0.01 compared with control in hypoxia. β-actin and Ponceau red staining served as the controls for total protein levels. B, Astrocytes were transfected with siHIF-1α, and mRNA levels of HIF-1α, Ang1, and VEGF were analyzed by RT-PCR.
Figure 7.
Figure 7.
Negative regulation of HIF-1α by AKAP12. A, Human astrocytes were exposed to 24 h of normoxia (N) or hypoxia (24H), or 24 h of hypoxia followed by reoxygenation for 3 h (3R). Expression of AKAP12 and HIF-1α was examined by Western blot analysis. B, Human astrocytes were transfected with Akap12 (t-AKAP12), incubated for 12 h, then exposed to 24 h of normoxia or hypoxia, and expression of HIF-1α was analyzed by Western blot. The quantification of the immunoblot from three independent experiments is shown below. The expression under hypoxia was set to 100%. *p < 0.05 compared with control in hypoxic condition. C, Human astrocytes were transfected with Akap12, incubated for 12 h, then exposed to 24 h of normoxia or hypoxia, and expression of HIF-1α was analyzed by RT-PCR. D, Human astrocytes were transfected with siAkap12, incubated for 12 h, then exposed to 24 h of normoxia or hypoxia, and expression of AKAP12 and HIF-1α was analyzed by Western blot. β-actin was used as an internal control. The quantification of the immunoblot from four independent experiments is shown below. The expression was set to 100% in siAkap12-transfected hypoxic condition. *p < 0.05 compared with control in normoxic condition; #p < 0.01 compared with control in hypoxic condition. E, HIF-1α (green) expression under the same set of normoxic condition was also examined by immunofluorescence staining. Nuclei were stained with propidium iodide and are seen in red, and colocalization is seen as yellow fluorescence. Scale bar, 50 μm.
Figure 8.
Figure 8.
Regulation of transcriptional activities of HIF-1α and VEGF by AKAP12. A, For analysis of HIF-1 transcriptional activity, cells were transfected with pSV40pro-EpoHRE-Luc (1 μg) or mutated EpoHRE-Luc (1 μg), pBOS-HIF-1α (0.1 μg), pBOS-HIF-1β (0.1 μg), or empty vector (pEF-BOS, 0.2 μg), pCMV-β-gal (0.5 μg), and 2 μg of pcDNA3-Akap12 or pcDNA3, as indicated. Transfected cells were incubated for 12 h, then exposed to 24 h of normoxia or hypoxia. B, Cells were transfected with Akap12, incubated for 12 h, then exposed to 24 h of normoxia or hypoxia. VEGF expression was analyzed by Western blot analysis of CM (100 μg total protein) and RT-PCR. For analysis of VEGF transcriptional activity, cells were transfected with pcDNA-Akap12 or pcDNA (2 μg), the VEGF promoter vector pGL3-mVEGF (1 μg), pBOS-HIF-1α (0.1 μg), pBOS-HIF-1β (0.1 μg), or empty vector (pEF-BOS; 0.2 μg), and pCMV-β-gal (0.5 μg). After transfection, cells were incubated for 12 h and then exposed to 24 h normoxia or hypoxia.
Figure 9.
Figure 9.
AKAP12 decreases the stability of HIF-1α by increasing its association with pVHL. A, B, Human astrocytes were transfected with AKAP12 or siAkap12, incubated for 12 h, and then exposed to 24 h of normoxia or hypoxia. Cells were treated with 8 μm MG132 for 4 h and then cell extracts were subjected to immunoprecipitation using anti-pVHL antibody. Immunoprecipitates were analyzed by Western blot using anti-HIF-1α antibody (A). The quantification of the immunoblot from three independent experiments is shown (B). *p < 0.05 compared with control in normoxic condition. C, 786-O renal clear cell carcinoma cells were transfected with Akap12 (1.5 μg) and green fluorescent protein (GFP)-HIF-1α (1.5 μg). The expression of HIF-1α was analyzed by Western blot and RT-PCR. D, 786-O cells and 786-O cells expressing pVHL (786-O cell/pVHL) were transfected with siAkap12 and GFP-HIF-1α (1.5 μg), incubated for 12 h, then exposed to 24 h of normoxia or hypoxia, and expression of HIF-1α and pVHL was analyzed by Western blot. The quantification of the immunoblot from three independent experiments is shown below. *p < 0.05 compared with control in normoxic condition.
Figure 10.
Figure 10.
AKAP12 decreases the stability of HIF-1α by increasing its association with PHD2. A, B, Human astrocytes were transfected with Akap12 or siAkap12, incubated for 12 h, then exposed to 24 h of normoxia or hypoxia. Cells were treated with 8 μm MG132 for 4 h, then cell extracts were subjected to immunoprecipitation using anti-HIF-1α antibody. Immunoprecipitates were analyzed by Western blot using anti-PHD2 specific antibody (A). The quantification of the immunoblot from three independent experiments is shown (B). *p < 0.05 compared with control in normoxic condition. C, Human astrocytes were cotransfected with rat Akap12 (2 μg) and siRNA targeting PHD2 (siPHD), incubated for 12 h, then exposed to 24 h of normoxia or hypoxia. Levels of transfected AKAP12 (t-AKAP12), HIF-1α, and PHD2 were analyzed by Western blot. The quantification of the immunoblot from three independent experiments is shown below. *p < 0.05 compared with mock-transfected hypoxic condition; #p < 0.05 compared with Akap12-transfected hypoxic condition. D, HT1080 cells under hypoxic conditions were treated with 300 μm of the PHD inhibitors such as Mim and ethyl DHB for 16 h. t-AKAP12 and HIF-1α expression were analyzed by Western blot.

Similar articles

Cited by

References

    1. Abbott NJ, Ronnback L, Hansson E. Astrocyte-endothelial interactions at the blood-brain barrier. Nat Rev Neurosci. 2006;7:41–53. - PubMed
    1. Appelhoff RJ, Tian YM, Raval RR, Turley H, Harris AL, Pugh CW, Ratcliffe PJ, Gleadle JM. Differential function of the prolyl hydroxylases PHD1, PHD2, and PHD3 in the regulation of hypoxia-inducible factor. J Biol Chem. 2004;279:38458–38465. - PubMed
    1. Berra E, Benizri E, Ginouves A, Volmat V, Roux D, Pouyssegur J. HIF prolyl-hydroxylase 2 is the key oxygen sensor setting low steady-state levels of HIF-1alpha in normoxia. EMBO J. 2003;22:4082–4090. - PMC - PubMed
    1. Brown RC, Davis TP. Hypoxia/aglycemia alters expression of occludin and actin in brain endothelial cells. Biochem Biophys Res Commun. 2005;327:1114–1123. - PubMed
    1. Brown RC, Mark KS, Egleton RD, Davis TP. Protection against hypoxia-induced blood-brain barrier disruption: changes in intracellular calcium. Am J Physiol Cell Physiol. 2004;286:C1045–1052. - PubMed

Publication types

MeSH terms

LinkOut - more resources