. 2007 Apr 20:8:131.
doi: 10.1186/1471-2105-8-131.

Statistical significance of quantitative PCR

Affiliations

Statistical significance of quantitative PCR

Yann Karlen et al. BMC Bioinformatics. .

Abstract

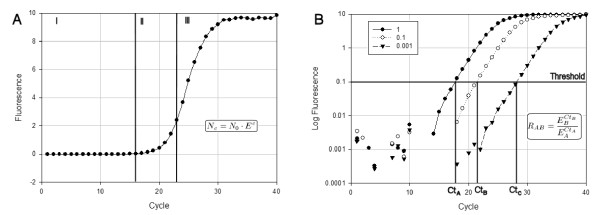
Background: PCR has the potential to detect and precisely quantify specific DNA sequences, but it is not yet often used as a fully quantitative method. A number of data collection and processing strategies have been described for the implementation of quantitative PCR. However, they can be experimentally cumbersome, their relative performances have not been evaluated systematically, and they often remain poorly validated statistically and/or experimentally. In this study, we evaluated the performance of known methods, and compared them with newly developed data processing strategies in terms of resolution, precision and robustness.

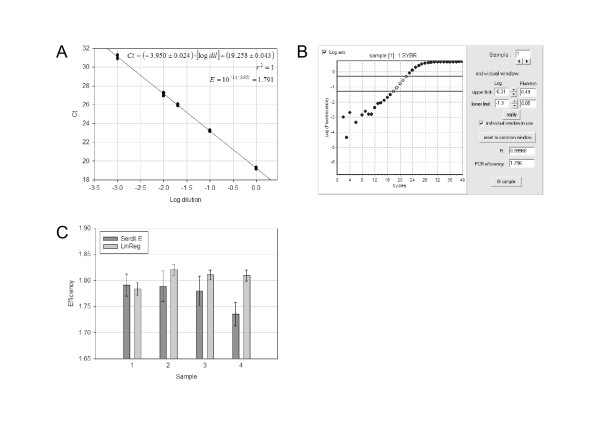
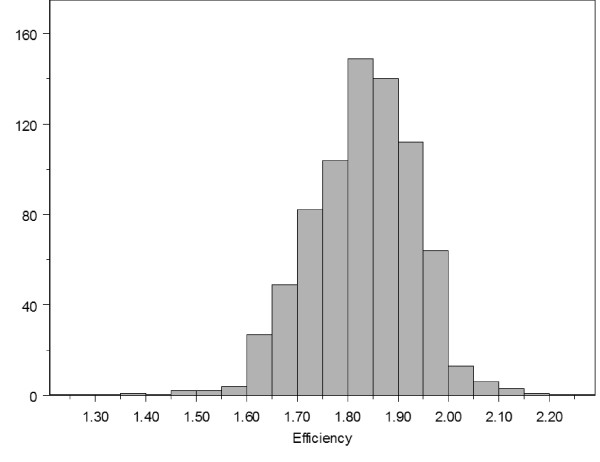
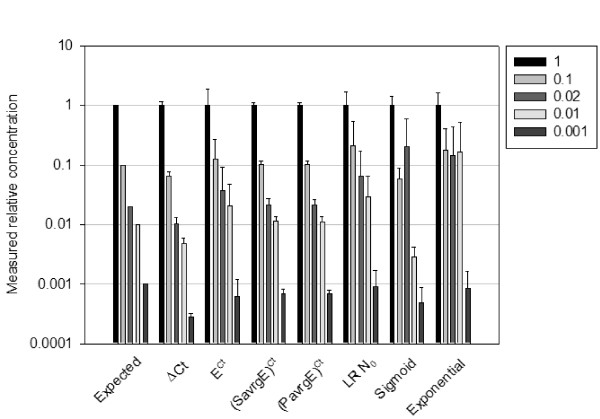
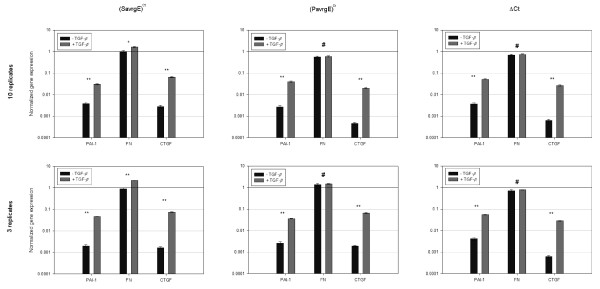
Results: Our results indicate that simple methods that do not rely on the estimation of the efficiency of the PCR amplification may provide reproducible and sensitive data, but that they do not quantify DNA with precision. Other evaluated methods based on sigmoidal or exponential curve fitting were generally of both poor resolution and precision. A statistical analysis of the parameters that influence efficiency indicated that it depends mostly on the selected amplicon and to a lesser extent on the particular biological sample analyzed. Thus, we devised various strategies based on individual or averaged efficiency values, which were used to assess the regulated expression of several genes in response to a growth factor.

Conclusion: Overall, qPCR data analysis methods differ significantly in their performance, and this analysis identifies methods that provide DNA quantification estimates of high precision, robustness and reliability. These methods allow reliable estimations of relative expression ratio of two-fold or higher, and our analysis provides an estimation of the number of biological samples that have to be analyzed to achieve a given precision.


Figures

Figure 1
Figure 1
Representations of real-time PCR amplification curves. The three phases of the amplification reaction are shown either on a linear scale (panel A) or on a semi-log scale (panel B). Panel A represents a typical amplification curve, while panel B depicts amplification curves generated from serial dilutions of the same sample, either undiluted or diluted 10- or 1000-fold (indicated as 1, 0.1 or 0.001, respectively). During the lag phase (phase I), the fluorescence resulting from DNA amplification is undetectable above noise fluorescence in part A, while in part B, some data points take negative values and are not represented. This phase is used to evaluate the baseline "noise" of the PCR amplification. Exponential amplification of the DNA is detected in phase II (cycles 16 to 23, panel A). This phase of the amplification corresponds to the linear portion of the curve in panel B (closed circles). A threshold value is usually set by the user to cross the log linear portion of the curve, defining the threshold cycle value (Ct). Phase II is followed by a linear or plateau phase as reactants become exhausted (phase III). The inserted equations describe the dynamic of the amplification during phase II.
Figure 2
Figure 2
Measurement of the efficiency of a PCR reaction. A: Estimation of the efficiency using the Serial dilution (SerDil) method. Five dilutions of a cDNA sample were amplified using the fibronectin (FN) amplicon. Each dilution was analyzed with five replicates PCR reactions and each data point represents one Ct value determined as in Figure 1B. Linear regression parameters and calculation of the efficiency value are shown in the inserted textbox. B: Screenshot of the LinReg PCR program analysis window, which allows the estimation of the efficiency value from each set of amplification curves [13]. Data correspond to one of the reactions performed from the undiluted sample used in part A. C: Comparison of the efficiency values obtained using the Serial dilution and LinReg methods for the FN amplicon. Efficiency values were determined from four independent cDNA samples using the Serial Dilution method as in part A, or the LinReg method as in part B. For each sample, efficiency value were either determined from one linear regression performed on 24 reactions altogether (Serdil) and error bars calculated from the standard deviation on the slope as determined from the linear regression method or the individual efficiency values determined from each of the same 24 PCR reactions (LinReg) were averaged, and error bars represent the standard deviation on the set of values.
Figure 3
Figure 3
Distribution of efficiency values in the complete data set. Efficiency of 704 PCR reactions encompassing different cDNA samples, primers and dilutions are shown as determined using the LinReg method, as done in Figure 2B.
Figure 4
Figure 4
Comparison of the different calculation models when applied to samples of known relative concentrations. Each cDNA samples serial dilutions were processed with the indicated models, measured concentration were expressed as relative to the undiluted sample. Then results of all amplicons were averaged for a given model.
Figure 5
Figure 5
Comparison of the (SavrgE)Ct, (PavrgE)Ct and ΔCt methods to quantify gene expression regulation. cDNAs were prepared from RNA extracted from fibroblastic cells induced or not by TGF-β treatment, as described in the Materials and methods. Expression as determined from the mRNA levels of the plasminogen activator inhibitor 1 (PAI-1), fibronectin (FN) and connective tissue growth factor (CTGF) genes were normalized to those of the ribosomal L27 protein, used as an invariant internal reference. Normalized gene expression was calculated using the (SavrgE)Ct, (PavrgE)Ct or the ΔCt methods, as indicated, using either the complete set of 10 replicate assays (top histograms), or using just three measurements (first three assays of the series, bottom histograms). Error bars represent standard deviations on the normalized ratio. A t-test was performed on the normalized gene expression to check whether the expression were statistically different between the induced and the non-induced state (* = p < 0.05, ** = p < 0.001, # = p > 0.1).

Similar articles

Cited by

References

    1. Ailenberg M, Silverman M. Controlled hot start and improved specificity in carrying out PCR utilizing touch-up and loop incorporated primers (TULIPS) Biotechniques. 2000;29:1018–20, 1022-4. - PubMed
    1. Etienne W, Meyer MH, Peppers J, Meyer RA., Jr. Comparison of mRNA gene expression by RT-PCR and DNA microarray. Biotechniques. 2004;36:618–20, 622, 624-6. - PubMed
    1. Rajeevan MS, Ranamukhaarachchi DG, Vernon SD, Unger ER. Use of real-time quantitative PCR to validate the results of cDNA array and differential display PCR technologies. Methods. 2001;25:443–451. doi: 10.1006/meth.2001.1266. - DOI - PubMed
    1. Higuchi R, Dollinger G, Walsh PS, Griffith R. Simultaneous amplification and detection of specific DNA sequences. Biotechnology (N Y) 1992;10:413–417. doi: 10.1038/nbt0492-413. - DOI - PubMed
    1. Wittwer CT, Herrmann MG, Moss AA, Rasmussen RP. Continuous fluorescence monitoring of rapid cycle DNA amplification. Biotechniques. 1997;22:130–1, 134-8. - PubMed

Publication types

MeSH terms

LinkOut - more resources