

Specific blockage of ligand-induced degradation of the Ah receptor by proteasome but not calpain inhibitors in cell culture lines from different species
- PMID: 17445780
- PMCID: PMC2001188
- DOI: 10.1016/j.bcp.2007.03.021
Specific blockage of ligand-induced degradation of the Ah receptor by proteasome but not calpain inhibitors in cell culture lines from different species
Abstract
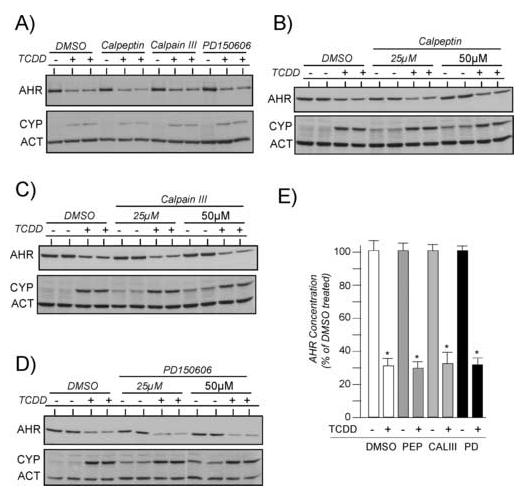
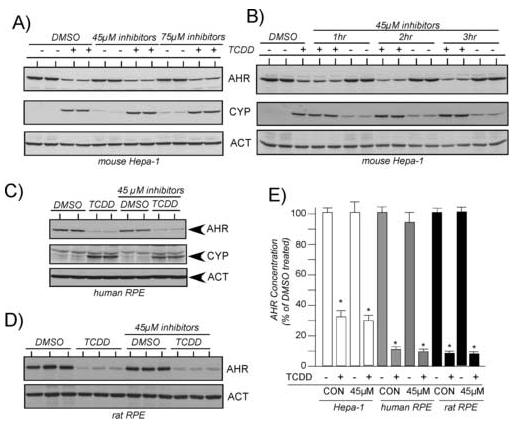
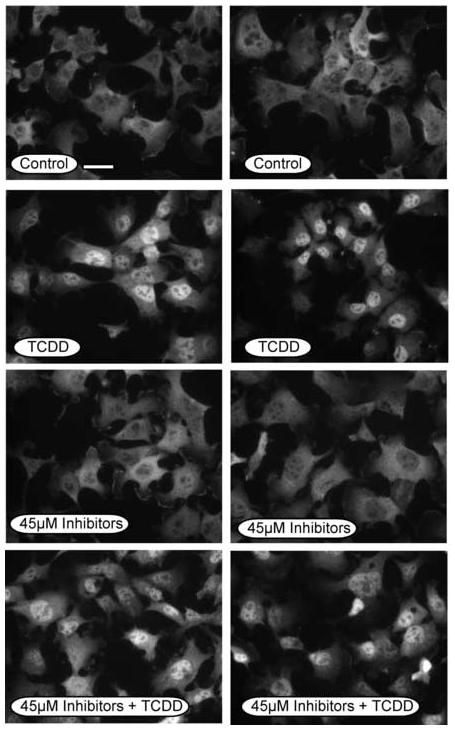
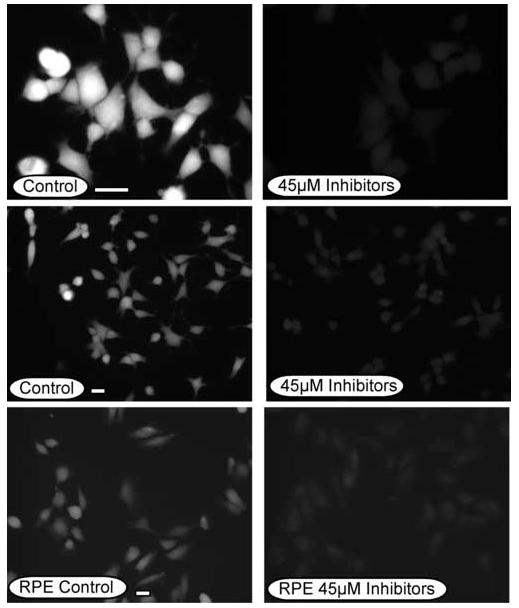
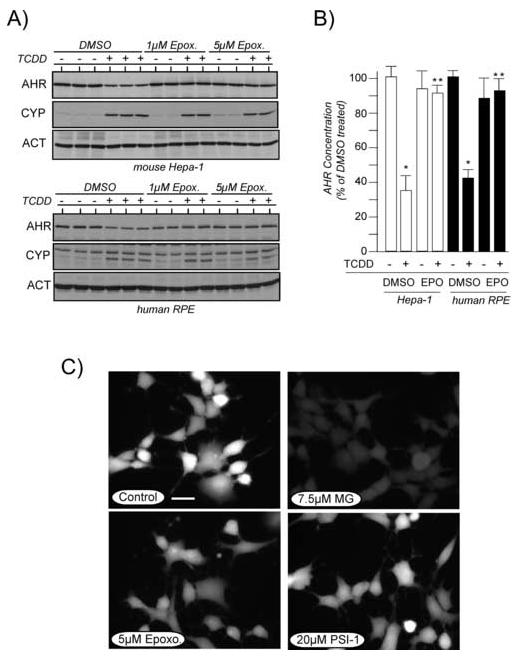
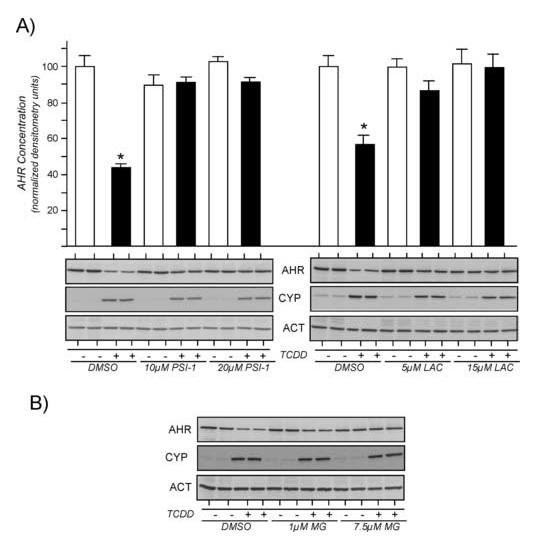
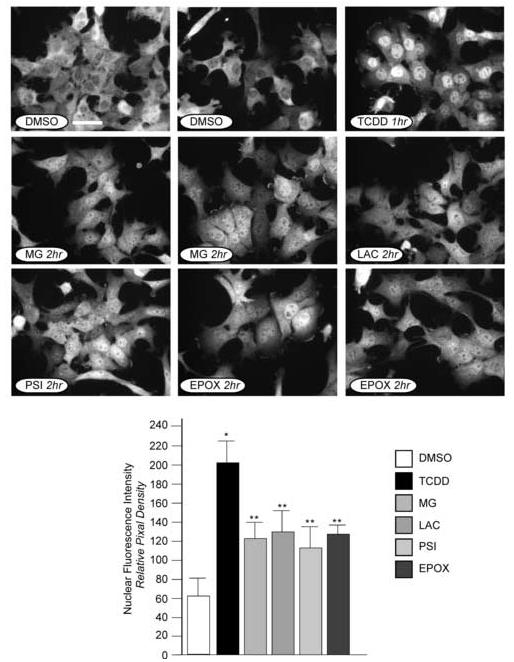
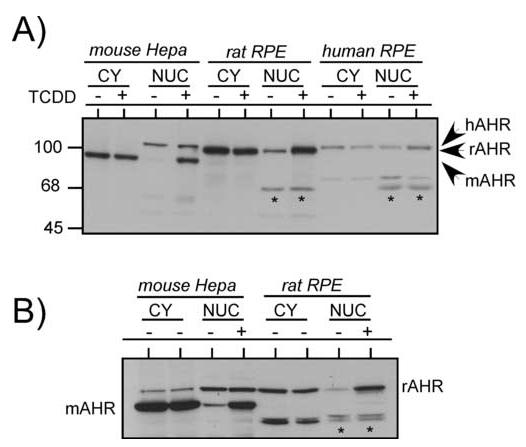
To firmly establish the pathway involved in ligand-induced degradation of the AHR, cell lines derived from mouse rat or human tissues were exposed to inhibitors specific to the proteasome or calpain proteases and exposed to TCDD. The level of endogenous AHR and CYP1A1 protein was then evaluated by quantitative Western blotting. Treatment of cells with the calpain inhibitors: calpeptin, calpain inhibitor III, or PD150606 either individually or in combinations up to 75 microM did not reduce TCDD-induced degradation of the AHR, the induction of endogenous CYP1A1 or the nuclear accumulation of the AHR. The activity of the inhibitors was verified with an in vivo calpain assay. In contrast, exposure of cells to the specific proteasome inhibitors: epoxomicin (1-5 microM), proteasome inhibitor I (5-10 microM) or lactacystin (5-15 microM) completely inhibited TCDD-induced degradation of the AHR. Inhibition of AHR degradation with these compounds did not reduce the induction of endogenous CYP1A1. In addition, exposure of the Hepa-1 line to the various proteasome inhibitors caused an accumulation of the AHR in the nucleus in the absence of TCDD exposure. Finally, Western blot analysis of the DNA bound AHR showed that its molecular mass was unchanged in comparison to the unliganded (cytoplasmic) AHR. Thus, these studies conclusively implicate the proteasome and not calpain proteases in the ligand-induced degradation of the mouse, rat and human AHR and suggest that the pharmacological use of proteasome inhibitors may impact the time course and magnitude of gene regulatory events mediated through the AHR.
Figures
Similar articles
-
Functional analysis of murine aryl hydrocarbon (AH) receptors defective in nuclear import: impact on AH receptor degradation and gene regulation.Mol Pharmacol. 2003 Mar;63(3):597-606. doi: 10.1124/mol.63.3.597. Mol Pharmacol. 2003. PMID: 12606767
-
Cobaltous chloride and hypoxia inhibit aryl hydrocarbon receptor-mediated responses in breast cancer cells.Toxicol Appl Pharmacol. 2007 Aug 15;223(1):28-38. doi: 10.1016/j.taap.2007.05.010. Epub 2007 May 25. Toxicol Appl Pharmacol. 2007. PMID: 17599377 Free PMC article.
-
Calpain mediates the dioxin-induced activation and down-regulation of the aryl hydrocarbon receptor.Mol Pharmacol. 2006 Nov;70(5):1481-7. doi: 10.1124/mol.106.027474. Epub 2006 Aug 4. Mol Pharmacol. 2006. PMID: 16891617
-
Ligand-dependent and independent modulation of aryl hydrocarbon receptor localization, degradation, and gene regulation.Mol Pharmacol. 2002 Oct;62(4):806-16. doi: 10.1124/mol.62.4.806. Mol Pharmacol. 2002. PMID: 12237327
-
Role of coactivators in transcriptional activation by the aryl hydrocarbon receptor.Arch Biochem Biophys. 2005 Jan 15;433(2):379-86. doi: 10.1016/j.abb.2004.09.031. Arch Biochem Biophys. 2005. PMID: 15581594 Review.
Cited by
-
Indenopyrene and Blue-Light Co-Exposure Impairs the Tightly Controlled Activation of Xenobiotic Metabolism in Retinal Pigment Epithelial Cells: A Mechanism for Synergistic Toxicity.Int J Mol Sci. 2023 Dec 12;24(24):17385. doi: 10.3390/ijms242417385. Int J Mol Sci. 2023. PMID: 38139215 Free PMC article.
-
Differential Regulation of the Asthmatic Phenotype by the Aryl Hydrocarbon Receptor.Front Physiol. 2021 Oct 21;12:720196. doi: 10.3389/fphys.2021.720196. eCollection 2021. Front Physiol. 2021. PMID: 34744763 Free PMC article.
-
2,3,7,8-Tetrachlorodibenzo-p-dioxin poly(ADP-ribose) polymerase (TiPARP, ARTD14) is a mono-ADP-ribosyltransferase and repressor of aryl hydrocarbon receptor transactivation.Nucleic Acids Res. 2013 Feb 1;41(3):1604-21. doi: 10.1093/nar/gks1337. Epub 2012 Dec 28. Nucleic Acids Res. 2013. PMID: 23275542 Free PMC article.
-
Transcriptional and posttranslational inhibition of dioxin-mediated induction of CYP1A1 by harmine and harmol.Toxicol Lett. 2012 Jan 5;208(1):51-61. doi: 10.1016/j.toxlet.2011.09.030. Epub 2011 Oct 6. Toxicol Lett. 2012. PMID: 22001777 Free PMC article.
-
The Aryl Hydrocarbon Receptor and the Maintenance of Lung Health.Int J Mol Sci. 2018 Dec 5;19(12):3882. doi: 10.3390/ijms19123882. Int J Mol Sci. 2018. PMID: 30563036 Free PMC article. Review.
References
-
- Kewley RJ, Whitelaw ML, Chapman-Smith A. The mammalian basic helix-loop-helix/PAS family of transcriptional regulators. Int J Biochem Cell Biol. 2004;36:189–204. - PubMed
-
- Pandini A, Bonati L. Conservation and specialization in PAS domain dynamics. Protein Eng Des Sel. 2005;18:127–37. - PubMed
-
- Carney SA, Prasch AL, Heideman W, Peterson RE. Understanding dioxin developmental toxicity using the zebrafish model. Birth Defects Res A Clin Mol Teratol. 2006;76:7–18. - PubMed
-
- Mandal PK. Dioxin: a review of its environmental effects and its aryl hydrocarbon receptor biology. J Comp Physiol. 2005;175:221–30. - PubMed
-
- Pollenz RS. Mechanism of Ah receptor down regulation (degradation) and its impact on AHR-mediated gene regulation. Chemico Biological Inter. 2002;141:41–61. - PubMed
Publication types
MeSH terms
Substances
Grants and funding
LinkOut - more resources
Full Text Sources
