. 2007 Jul 1;582(Pt 1):137-51.
doi: 10.1113/jphysiol.2007.132050. Epub 2007 Apr 19.

Control of basal extracellular adenosine concentration in rat cerebellum

Affiliations

Control of basal extracellular adenosine concentration in rat cerebellum

Mark J Wall et al. J Physiol. .

Abstract

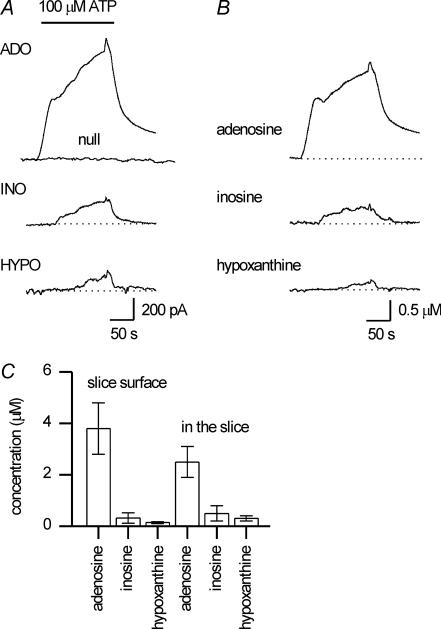
To re-examine how the basal extracellular concentration of adenosine is regulated in acutely isolated cerebellar slices we have combined electrophysiological and microelectrode biosensor measurements. In almost all cases, synaptic transmission was tonically inhibited by adenosine acting via A1 receptors. By contrast, in most slices, the biosensors did not measure an adenosine tone but did record a spatially non-uniform extracellular tone of the downstream metabolites (inosine and hypoxanthine). Most of the extracellular hypoxanthine arose from the metabolism of inosine by ecto-purine nucleoside phosphorylase (PNP). Adenosine kinase was the major determinant of adenosine levels, as its inhibition increased both adenosine concentration and A1 receptor-mediated synaptic inhibition. Breakdown of adenosine by adenosine deaminase was the major source of the inosine/hypoxanthine tone. However adenosine deaminase played a minor role in determining the level of adenosine at synapses, suggesting a distal location. Blockade of adenosine transport (by NBTI/dipyridamole) had inconsistent effects on basal levels of adenosine and synaptic transmission. Unexpectedly, application of NBTI/dipyridamole prevented the efflux of adenosine resulting from block of adenosine kinase at only a subset of synapses. We conclude that there is spatial variation in the functional expression of NBTI/dipyridamole-sensitive transporters. The increased spatial and temporal resolution of the purine biosensor measurements has revealed the complexity of the control of adenosine and purine tone in the cerebellum.


Figures

Figure 1
Figure 1. Endogenous adenosine inhibits parallel fibre to Purkinje cell synaptic transmission
A, average of 50 pairs (interval 50 ms) of parallel fibre–Purkinje cell (PF) EPSPs illustrating paired pulse facilitation (greater amplitude of second EPSP compared to first). PF EPSPs were averaged by aligning on the stimulus artefact. B, the A1 receptor antagonist 8CPT (1 μm) increased PF EPSP amplitude (31%) demonstrating tonic activation of A1 receptors. PF EPSPs were blocked by CNQX (10 μm), confirming their production through glutamate receptor activation. Graph plots the amplitude of individual PF EPSPs against time. C, The antagonist 8CPT (1 μm) decreased the paired pulse ratio, confirming a presynaptic site of action. Graph plots the paired pulse ratio against time for the PF EPSPs in B. The line is the mean paired pulse ratio for five EPSPs. D, adenosine (100 μM) reversibly decreased PF EPSP amplitude (48%). Graph plots the amplitude of individual PF EPSPs against time. E, adenosine produced a marked increase in the paired pulse ratio, indicating a presynaptic site of action. Graph plots the paired pulse ratio against time for the PF EPSPs in D. The line is the mean paired pulse ratio for three EPSPs. F, graph summarising the actions of purines on PF EPSP amplitude (n= 5–12).
Figure 2
Figure 2. Adenosine metabolites, but not adenosine, can be measured in the extracellular space of cerebellar slices
A, example of biosensor traces from an experiment to measure the concentration of purines at the slice surface. Superimposed traces from ADO, INO, HYPO and ATP sensors. After the biosensors were moved close to the slice surface there was a rapid increase in the baseline current of ∼300–500 pA on the ADO, INO and HYPO sensors. Moving the ATP biosensor close to the slice produced a small drop in the baseline current. B, the traces from A were normalised by calibration and subtracted to give the amounts of adenosine, inosine and hypoxanthine detected at the slice surface (see Methods). C, graph plots the mean concentration of purines measured at the surface of 12 cerebellar slices. Currents were scaled by sensor calibration and then subtracted (as in B). D, examples of experiments where biosensors were used to measure the purine concentration within slices. Biosensors were carefully pushed into slices, left in position for ∼30 min and then withdrawn. The top panel shows the response following removal of an ATP sensor from a slice. There is a small sustained increase in current (similar to that observed on null sensors) and thus no ATP was detected. In contrast when an inosine (INO) sensor was removed there was a sustained fall in current as a result of terminating purine detection (bottom panel). The transient upward deflections (arrows) are presumably due to cell damage and the release and resultant metabolism of ATP. E, graph plotting the mean concentration of purines measured in the extracellular space of 16 cerebellar slices. Currents were scaled by sensor calibration and then subtracted (see Methods).
Figure 3
Figure 3. Exogenous ATP is metabolised by cerebellar slices
A, example traces from adenosine (ADO), null, inosine (INO) and hypoxanthine (HYPO) biosensors placed on the surface of a cerebellar slice. Following application of 100 μm ATP, currents were produced on all the sensors except the null. B, the traces from A, calibrated and subtracted illustrating the metabolism of ATP to adenosine, inosine, and hypoxanthine. C, graph plots the mean concentration of ATP metabolites measured at the surface of slices (n= 6) and within slices (n= 7) following application of 100 μm ATP.
Figure 4
Figure 4. Extracellular purine nucleoside phosphorylase (PNP) metabolises inosine to hypoxanthine in cerebellar slices
A, record from a HYPO biosensor placed on the surface of a cerebellar slice (the sensor was bent so that it was laid parallel to the slice surface, increasing the sensitivity of purine detection). Application of 100 μm inosine (bar) produced a large current on the sensor due to rapid conversion of inosine to hypoxanthine. Application of the PNP inhibitor, immucillin H (200 nm), markedly reduced the conversion of inosine to hypoxanthine. Following wash there was recovery in the conversion of inosine to hypoxanthine. B, the same sensor as A, with no slice present. The sensor responds to hypoxanthine but does not respond to inosine.
Figure 5
Figure 5. Inhibition of adenosine kinase increases the extracellular concentration of adenosine
A, the adenosine kinase inhibitor iodotubercidin (1 μm) caused a reduction in PF EPSP amplitude (∼50%) which was reversed by the A1 receptor antagonist 8CPT (1 μm). At the end of the experiment, PF EPSPs were blocked by kynurenate (5 mm). Graph plots the amplitude of individual PF EPSPs against time. Inset, iodotubercidin (1 μm) caused an increase in the paired pulse ratio, confirming presynaptic inhibition due to adenosine efflux. Graph plots the paired pulse ratio against time for the PF EPSPs in A. The average paired pulse ratio for five EPSPs is plotted. B, trace from an ADO and INO sensor placed within the same slice as A. Application of iodotubercidin (1 μm) produced a current on the ADO sensor with little effect on the INO sensor. After calibration there was a net increase in the extracellular adenosine concentration of ∼0.5 μm. C, the equilibrative transport inhibitors NBTI (5 μm) and dipyridamole (10 μm) inhibited PF EPSP amplitude and occluded the effects of iodotubercidin. Although iodotubericidin (2 μm) had no effect on PF EPSP amplitude (in the presence of NBTI/dipyridamole), the adenosine receptors were not saturated as application of adenosine (100 μm) produced increased inhibition. The modulation of PF EPSPs was reversed by block of A1 receptors (1 μm 8CPT), and EPSPs were blocked by kynurenate (5 mm) at the end of the experiment. D, NBTI (5 μm) and dipyridamole (10 μm) caused a small inhibition of PF EPSP amplitude but did not occlude the effects of iodotubercidin. Application of 2 μm iodotubericidin (in the presence of NBTI/dipyridamole) markedly inhibited EPSP amplitude. The modulation of PF EPSPs was reversed by block of A1 receptors (1 μm 8CPT), and EPSPs were blocked by 5 mm kynurenate at the end of the experiment.
Figure 6
Figure 6. Blocking equilibrative transport has heterogeneous effects
A, application of ATP (100 μm) caused a reversible inhibition of PF EPSP amplitude. Block of equilibrative transport with 5 μm NBTI and 10 μm dipyridamole caused a reduction in PF EPSP amplitude, which was reversed by block of A1 receptors with 8CPT (1 μm). PF EPSPs were blocked by CNQX at the end of the experiment. Graph plots the amplitude of individual PF EPSPs against time. Inset, application of ATP (*) and NBTI/dipyridamole caused an increase in the paired pulse ratio, confirming a presynaptic site of action. Graph plots the paired pulse ratio against time for the PF EPSPs in A. The average paired pulse ratio for five EPSPs is plotted. B, trace from an ADO biosensor present in the same slice as A. Application of 100 μm ATP caused an increase in adenosine concentration (as a result of metabolism), but 5 μM NBTI/10 μm dipyridamole had no effect. C, trace from an ADO biosensor in a different slice. Application of 5 μm NBTI/10 μm dipyridamole produced a current on the sensor, suggesting an increase in the concentration of purines in the bulk of the slice. D, application of ATP (100 μm) caused a reduction in PF EPSP amplitude, but 5 μm NBTI/10 μm dipyridamole had no effect. There was also no effect on the paired pulse ratio (not illustrated). There is an adenosine tone, as block of A1 receptors with 8CPT (1 μm) increased PF EPSP amplitude. PF EPSPs were blocked by CNQX (10 μm) at the end of the experiment.
Figure 7
Figure 7. The metabolism of adenosine contributes to the extracellular inosine/hypoxanthine tone but has little effect on synaptic transmission
A, the adenosine deaminase inhibitor EHNA (20 μm) caused a reduction in EPSP amplitude (∼17%), which was reversed by block of A1 receptors with 8CPT (1 μm). EPSPs were blocked at the end of the experiment with 5 mm kynurenate. Graph plots the amplitude of individual PF EPSPs against time. B, EHNA caused an increase in the paired pulse ratio whereas 8CPT reduced the ratio, confirming a presynaptic site of action. Graph plots the paired pulse ratio against time for the PF EPSPs in A. The average paired pulse ratio for five EPSPs is plotted. C, trace from an INO sensor placed within the same slice as A. Application of EHNA caused a fall in the concentration of the adenosine metabolites inosine/hypoxanthine.
Figure 8
Figure 8. What is the source of endogenous adenosine?
A, superimposed traces from ADO and HYPO biosensors placed parallel to the molecular layer surface. Following stimulation (5 V, 20 Hz, 10 s) in the molecular layer, adenosine is released and a proportion is metabolised to hypoxanthine. The traces are normalised by the biosensor calibration, assuming that all ADO biosensor signal results from adenosine detection. B, application of α,β-methylene-ADP (100 μm) and ARL67156 (100 μm), to reduce conversion of ATP to adenosine, had no effect on PF EPSP amplitude. However, application of 8CPT (1 μm) increased PF EPSP amplitude, demonstrating that synaptic A1 receptors were activated by endogenous adenosine. Graph plots the amplitude of individual PF EPSPs against time. C, trace from ADO biosensor positioned in the same slice as A. Application of 100 μmα,β-methylene-ADP and ARL67156 had no effect on the baseline current. D, application of α,β-methylene-ADP (100 μm) and ARL67156 (100 μm) increased PF EPSP amplitude. Upon wash there was a transient reduction in PF EPSP amplitude below control levels. E, trace from ADO biosensor positioned in the same slice as D. Addition of α,β-methylene-ADP and ARL67156 caused a reduction in the baseline current (reduction in the conversion of ATP to adenosine, coincident with increase in PF EPSP amplitude). Upon wash there was a transient increase in the level of adenosine, which coincided with the inhibition of PF EPSP amplitude.

References

    1. Agarwal RP. Inhibitors of adenosine deaminase. Pharmacol Ther. 1982;17:399–429. - PubMed
    1. Anderson CM, Baldwin SA, Young JD, Cass CE, Parkinson FE. Distribution of mRNA encoding a nitrobenzylthioinosine-insensitive nucleoside transporter (ENT2) in rat brain. Brain Res Mol Brain Res. 1999a;70:293–297. - PubMed
    1. Anderson CM, Xiong W, Geiger JD, Young JD, Cass CE, Baldwin SA, Parkinson FE. Distribution of equilibrative, nitrobenzylthioinosine-sensitive nucleoside transporters (ENT1) in brain. J Neurochem. 1999b;73:867–873. - PubMed
    1. Arcuino G, Lin JH, Takano T, Liu C, Jiang L, Gao Q, Kang J, Nedergaard M. Intercellular calcium signaling mediated by point-source burst release of ATP. Proc Natl Acad Sci U S A. 2002;99:9840–9845. - PMC - PubMed
    1. Atluri PP, Regehr WG. Determinants of the time course of facilitation at the granule cell to Purkinje cell synapse. J Neurosci. 1996;16:5661–5671. - PMC - PubMed

Publication types

MeSH terms