. 2007 Aug 1;582(Pt 3):1125-39.
doi: 10.1113/jphysiol.2007.128447. Epub 2007 Apr 19.

Modulation of multisegmental monosynaptic responses in a variety of leg muscles during walking and running in humans

Affiliations

Modulation of multisegmental monosynaptic responses in a variety of leg muscles during walking and running in humans

Grégoire Courtine et al. J Physiol. .

Abstract

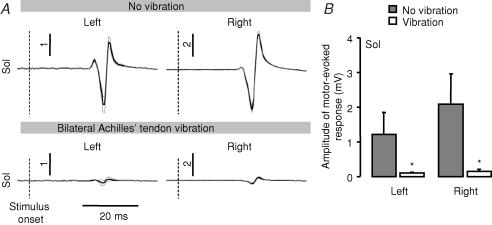
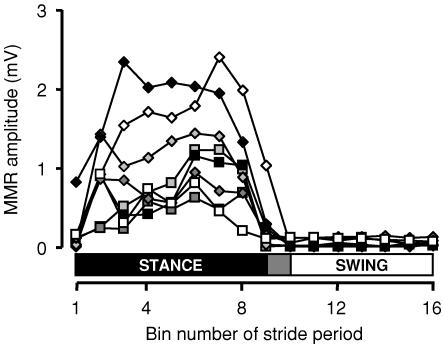
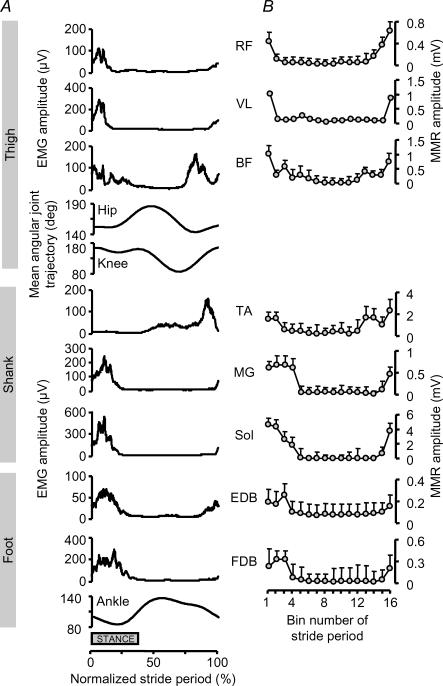
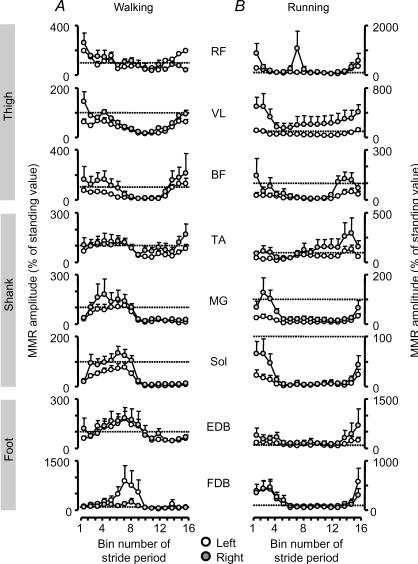
Motor responses evoked by stimulating the spinal cord percutaneously between the T11 and T12 spinous processes were studied in eight human subjects during walking and running. Stimulation elicited responses bilaterally in the biceps femoris, vastus lateralis, rectus femoris, medial gastrocnemius, soleus, tibialis anterior, extensor digitorum brevis and flexor digitorum brevis. The evoked responses were consistent with activation of Ia afferent fibres through monosynaptic neural circuits since they were inhibited when a prior stimulus was given and during tendon vibration. Furthermore, the soleus motor responses were inhibited during the swing phase of walking as observed for the soleus H-reflex elicited by tibial nerve stimulation. Due to the anatomical site and the fibre composition of the peripheral nerves it is difficult to elicit H-reflex in leg muscles other than the soleus, especially during movement. In turn, the multisegmental monosynaptic responses (MMR) technique provides the opportunity to study modulation of monosynaptic reflexes for multiple muscles simultaneously. Phase-dependent modulation of the MMR amplitude throughout the duration of the gait cycle period was observed in all muscles studied. The MMR amplitude was large when the muscle was activated whereas it was generally reduced, or even suppressed, when the muscle was quiescent. However, during running, there was a systematic anticipatory increase in the amplitude of the MMR at the end of swing in all proximal and distal extensor muscles. The present findings therefore suggest that there is a general control scheme by which the transmission in the monosynaptic neural circuits is modulated in all leg muscles during stepping so as to meet the requirement of the motor task.


Figures

Figure 9
Figure 9. Evaluation of the crosstalk between the soleus and tibialis anterior muscles
A, each trace represents the average ±s.d. right soleus (Sol) and tibialis anterior (TA) EMG responses from 10 tibial nerve stimuli during sitting for one individual. B, each point represents the mean of the actual (open circles) and corrected (shaded circles) MMR amplitude (mV) for each of the 16 bins during 10 steps of walking (3.5 km h−1) for the tibialis anterior (TA) muscle for the subject depicted in A. C and D, each point represents the mean +s.d. of the corrected MMR amplitude (mV) for each of the 16 bins during 10 steps of walking (C, 3.5 km h−1) and running (D; 8.0 km h−1) for the tibialis anterior (TA) for five individuals.
Figure 1
Figure 1. Motor responses evoked by percutaneous stimulation of the lumbar segments of the spinal cord at the T11–T12 level in the prone position
Each trace is the average ±s.d. of 10 MMRs recorded in the left and right leg muscles from one individual. Muscles are in order vertically according to their anatomical location, i.e. from proximal to distal. The vertical bars indicate the scale for the amplitude (mV) of the EMG signal. The vertical dotted line represents the onset of the stimulation. The horizontal bar at the bottom indicates the scale for time (ms).
Figure 2
Figure 2. Comparison of the amplitude of motor responses evoked by two successive stimulations in the prone position
A, each trace is the average ±s.d. of 10 evoked motor responses to two successive electrical stimulations delivered with a 50 ms time interval recorded in the right leg muscles from one individual. The vertical dotted lines represent the stimuli onsets. B, mean (+s.d.) amplitudes of the evoked motor responses to the first (filled bar) and second (open bar) stimulations are shown for the left and right muscles of all individuals (n = 8). *Significant decrease in the amplitude of the motor response to the second stimulus compared with the first stimulus.
Figure 3
Figure 3. Effect of vibration on evoked responses in the soleus muscle
A, each trace is the average ±s.d. of 10 MMRs without vibration (upper traces) and with continuous, bilateral Achilles tendon vibration (lower traces) in the prone position. No vibration and vibration conditions are depicted with the same scale. The vertical dotted line represents the onset of the stimulation. The horizontal bar at the bottom indicates the scale for time (ms). B, mean (+s.d.) amplitudes of the MMRs in the left and right soleus muscles without vibration (filled bar) and with vibration (open bar). *Significant decrease in the amplitude of the MMR with vibration compared with without vibration.
Figure 4
Figure 4. Mean amplitude of MMRs in the right soleus muscle during walking for all individuals
Each point represents the right soleus mean MMR amplitude (mV) for each of the 16 bins for 10 steps of walking (3.5 km h−1) from all individuals. Each symbol designates an individual (n = 8). The horizontal bars indicate the stance and swing phase of gait. The shaded area shows the inter-subject variability in the timing of swing phase onset.
Figure 5
Figure 5. MMR modulation in the right leg muscles of one individual during walking at 3.5 km h−1 and running at 8 km h−1
Each trace represents the averaged MMRs from 10 step cycles for each of the 16 bins during walking (A) and running (B) for the thigh (rectus femoris, RF; vastus lateralis, VL; biceps femoris, BF), shank (tibialis anterior, TA; medial gastrocnemius, MG; soleus, Sol) and foot (extensor digitorum brevis, EDB; flexor digitorum brevis, FDB) muscles of the right leg. For each muscle, the traces represent a complete step cycle and are in order vertically starting at the top with heel strike. The shaded bars at the right side of the figure indicate the stance phase. The vertical bars indicate the scale for the amplitude (mV) of the EMG signal. The horizontal bar at the bottom indicates the scale for time (ms).
Figure 6
Figure 6. Mean EMG activity and MMR modulation in the right leg muscles from one individual during walking at 3.5 km h−1
A, each trace represents the averaged rectified EMG activity (μV) and hip, knee and ankle joint angles from 100 step cycles preceding the stimuli during walking (3.5 km h−1) for the thigh (rectus femoris, RF; vastus lateralis, VL; biceps femoris, BF), shank (tibialis anterior, TA; medial gastrocnemius, MG; soleus, Sol) and foot (extensor digitorum brevis, EDB; flexor digitorum brevis, FDB) muscles of the right leg. The horizontal bar at the bottom indicates the mean duration of the stance phase of gait. B, each point represents the mean +s.d. of the MMR amplitude (mV) during 10 steps for each of the 16 bins during walking from one individual.
Figure 7
Figure 7. Mean EMG activity and MMR modulation in the right leg muscles from the same subject during running at 8 km h−1
A, each trace represents the averaged rectified EMG activity (μV) and hip, knee and ankle joint angles from 100 step cycles preceding the stimuli during running (8.0 km h−1) for the thigh (rectus femoris, RF; vastus lateralis, VL; biceps femoris, BF), shank (tibialis anterior, TA; medial gastrocnemius, MG; soleus, Sol) and foot (extensor digitorum brevis, EDB; flexor digitorum brevis, FDB) muscles of the right leg. The horizontal bar at the bottom indicates the mean duration of the stance phase of gait. B, each point represents the mean +s.d. of the MMR amplitude (mV) during 10 steps for each of the 16 bins during walking from one individual.
Figure 8
Figure 8. MMR modulation in the left and right leg muscles for all the subjects during walking and running
Each point represents the mean +s.d. of the MMR amplitude (mV) for each of the 16 bins during 10 steps of walking (A; 3.5 km h−1) and running (B; 8.0 km h−1) for the thigh (rectus femoris, RF; vastus lateralis, VL; biceps femoris, BF), shank (tibialis anterior, TA; medial gastrocnemius, MG; soleus, Sol), and foot (extensor digitorum brevis, EDB; flexor digitorum brevis, FDB) muscles of the left (open circles) and right (shaded circles) legs from all individuals (n = 8), except for the VL (n = 5 on the left side and n = 6 on the left side) and the RF (n = 4 on both sides). Each point represents the mean value of the mean MMR amplitude for a given bin. Bin number 1 is the first time slice after heel strike. Open and shaded circles depict MMR amplitude of left and right muscles, respectively. The amplitude of the MMR for walking and running was normalized to the MMR amplitude during standing for each individual (MMR amplitude,% of standing (dashed horizontal line)).
Figure 10
Figure 10. Relationship between MMR amplitude of antagonist muscles during walking and running
The mean amplitude of the MMR (all subjects) recorded in each bin for each pair of antagonist muscles of the leg joint is plotted one against each other, i.e. extensor versus flexor muscle. Left,walking; right, running.

References

    1. Agduhr E. Vergleich der Neuritenanzahl in den Wurzeln der Spinalnerven bei Kröte, Maus, Hund und Mensch. Z Anat. 1934;102:194–210.
    1. Andersen JB, Sinkjaer T. The stretch reflex and H-reflex of the human soleus muscle during walking. Motor Control. 1999;3:151–157. - PubMed
    1. Beres-Jones JA, Harkema SJ. The human spinal cord interprets velocity-dependent afferent input during stepping. Brain. 2004;127:2232–2246. - PubMed
    1. Burke D, Gandevia SC, McKeon B. Monosynaptic and oligosynaptic contributions to human ankle jerk and H-reflex. J Neurophysiol. 1984;52:435–448. - PubMed
    1. Capaday C. The special nature of human walking and its neural control. Trends Neurosci. 2002;25:370–376. - PubMed

Publication types

LinkOut - more resources