

Deterministic characterization of stochastic genetic circuits
- PMID: 17446275
- PMCID: PMC1863463
- DOI: 10.1073/pnas.0610468104
Deterministic characterization of stochastic genetic circuits
Abstract
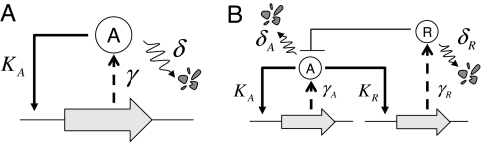
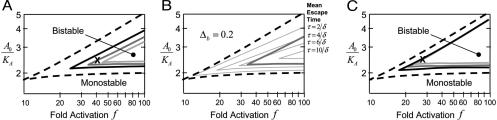
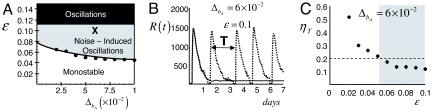
For cellular biochemical reaction systems where the numbers of molecules is small, significant noise is associated with chemical reaction events. This molecular noise can give rise to behavior that is very different from the predictions of deterministic rate equation models. Unfortunately, there are few analytic methods for examining the qualitative behavior of stochastic systems. Here we describe such a method that extends deterministic analysis to include leading-order corrections due to the molecular noise. The method allows the steady-state behavior of the stochastic model to be easily computed, facilitates the mapping of stability phase diagrams that include stochastic effects, and reveals how model parameters affect noise susceptibility in a manner not accessible to numerical simulation. By way of illustration we consider two genetic circuits: a bistable positive-feedback loop and a negative-feedback oscillator. We find in the positive feedback circuit that translational activation leads to a far more stable system than transcriptional control. Conversely, in a negative-feedback loop triggered by a positive-feedback switch, the stochasticity of transcriptional control is harnessed to generate reproducible oscillations.
Conflict of interest statement
The authors declare no conflict of interest.
Figures
Similar articles
-
Periodic synchronization of isolated network elements facilitates simulating and inferring gene regulatory networks including stochastic molecular kinetics.BMC Bioinformatics. 2022 Jan 5;23(1):13. doi: 10.1186/s12859-021-04541-6. BMC Bioinformatics. 2022. PMID: 34986805 Free PMC article.
-
Delays induce novel stochastic effects in negative feedback gene circuits.Biophys J. 2014 Jan 21;106(2):467-78. doi: 10.1016/j.bpj.2013.12.010. Biophys J. 2014. PMID: 24461022 Free PMC article.
-
Stochastic models for circadian rhythms: effect of molecular noise on periodic and chaotic behaviour.C R Biol. 2003 Feb;326(2):189-203. doi: 10.1016/s1631-0691(03)00016-7. C R Biol. 2003. PMID: 12754937 Review.
-
Stochastic analysis of a miRNA-protein toggle switch.Mol Biosyst. 2011 Oct;7(10):2796-803. doi: 10.1039/c1mb05086a. Epub 2011 Jun 30. Mol Biosyst. 2011. PMID: 21717010
-
Modeling cell-to-cell stochastic variability in intrinsic apoptosis pathway.Annu Int Conf IEEE Eng Med Biol Soc. 2012;2012:5498-501. doi: 10.1109/EMBC.2012.6347239. Annu Int Conf IEEE Eng Med Biol Soc. 2012. PMID: 23367174 Review.
Cited by
-
Analysis of stochastic bifurcations with phase portraits.PLoS One. 2018 Apr 24;13(4):e0196126. doi: 10.1371/journal.pone.0196126. eCollection 2018. PLoS One. 2018. PMID: 29689108 Free PMC article.
-
A minimal model of burst-noise induced bistability.PLoS One. 2017 Apr 27;12(4):e0176410. doi: 10.1371/journal.pone.0176410. eCollection 2017. PLoS One. 2017. PMID: 28448638 Free PMC article.
-
A computational pipeline for identifying kinetic motifs to aid in the design and improvement of synthetic gene circuits.BMC Bioinformatics. 2013;14 Suppl 16(Suppl 16):S5. doi: 10.1186/1471-2105-14-S16-S5. Epub 2013 Oct 22. BMC Bioinformatics. 2013. PMID: 24564638 Free PMC article.
-
Circuit-Host Coupling Induces Multifaceted Behavioral Modulations of a Gene Switch.Biophys J. 2018 Feb 6;114(3):737-746. doi: 10.1016/j.bpj.2017.12.010. Biophys J. 2018. PMID: 29414718 Free PMC article.
-
Bistability, probability transition rate and first-passage time in an autoactivating positive-feedback loop.PLoS One. 2011 Mar 21;6(3):e17104. doi: 10.1371/journal.pone.0017104. PLoS One. 2011. PMID: 21445288 Free PMC article.
References
Publication types
MeSH terms
LinkOut - more resources
Full Text Sources
Other Literature Sources
