. 2007 May;117(5):1282-93.
doi: 10.1172/JCI29042. Epub 2007 Apr 19.

Activation of MAPK pathways links LMNA mutations to cardiomyopathy in Emery-Dreifuss muscular dystrophy

Affiliations

Activation of MAPK pathways links LMNA mutations to cardiomyopathy in Emery-Dreifuss muscular dystrophy

Antoine Muchir et al. J Clin Invest. 2007 May.

Abstract

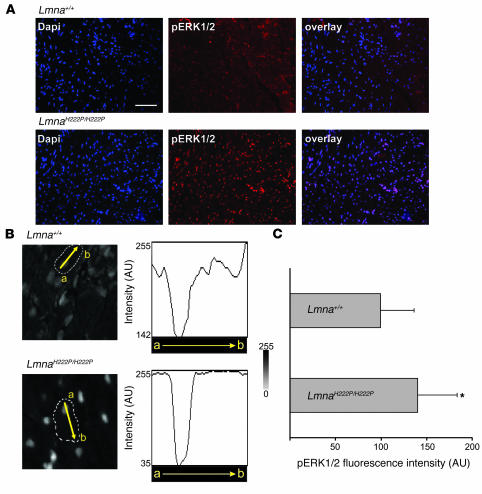
Mutations in LMNA, which encodes nuclear Lamins A and C cause diseases affecting various organs, including the heart. We have determined the effects of an Lmna H222P mutation on signaling pathways involved in the development of cardiomyopathy in a knockin mouse model of autosomal dominant Emery-Dreifuss muscular dystrophy. Analysis of genome-wide expression profiles in hearts using Affymetrix GeneChips showed statistically significant differences in expression of genes in the MAPK pathways at the incipience of the development of clinical disease. Using real-time PCR, we showed that activation of MAPK pathways preceded clinical signs or detectable molecular markers of cardiomyopathy. In heart tissue and isolated cardiomyocytes, there was activation of MAPK cascades and downstream targets, implicated previously in the pathogenesis of cardiomyopathy. Expression of H222P Lamin A in cultured cells activated MAPKs and downstream target genes. Activation of MAPK signaling by mutant A-type lamins could be a cornerstone in the development of heart disease in autosomal dominant Emery-Dreifuss muscular dystrophy.


Figures

Figure 1
Figure 1. RNA expression profiling in hearts of Lmna H222P mice.
(A) Hierarchical clustering analysis of differentially expressed genes in hearts from Lmna+/+, LmnaH222P/+, and LmnaH222P/H222P mice. Rows indicate the individual genes expressed and columns indicate each sample. A color is assigned to each gene depending on its expression (red indicates higher expression and green indicates lower expression). Transcriptional profiles of hearts of LmnaH222P/H222P and LmnaH222P/+ mice show a greater degree of similarity to each other than to hearts of control Lmna+/+ mice. (B) Volcano plots of absolute expression values (log2[q value]) determined by robust multichip analysis. For each probe set, expression in hearts from LmnaH222P/H222P and LmnaH222P/+ mice is plotted. A 2-fold threshold and q < 0.05 were used to determine the probe sets significantly altered in the analysis (red). (C) Validation of RNA expression profiling of selected genes in hearts from Lmna+/+, LmnaH222P/+, and LmnaH222P/H222P mice using real-time PCR. Bars indicate the fold overexpression of the indicated mRNA in hearts as calculated by the ΔδCT method. Values are mean ± SD for n = 6 samples per group. Real-time PCR was performed in triplicate with the different RNA samples. Matrices visualizing Affymetrix GeneChip data of corresponding probe sets of RNAs are shown at right of bar graph. In these matrices, each probe set is visualized as a row of colored squares with 1 square for each sample. Myh7, Myh4, Myl7, Acta2, and Sln show higher expression (red) and Pttg lower expression (green) compared with controls.
Figure 2
Figure 2. Histological analysis of heart muscle in Lmna H222P mice and expression of myosins and ANF.
(A) Histological analysis of hearts from 10-week-old control Lmna+/+ and LmnaH222P/H222P mice. Representative fixed sections of left ventricles stained with H&E (upper panels) and Gomori’s trichrome (lower panels) are shown. Note normal-appearing cardiomyocytes and absence of fibrosis. Scale bars: 50 μm. (B) Expression of myosins and ANF in hearts of 10-week-old Lmna+/+, LmnaH222P/+, and LmnaH222P/H222P mice. Representative immunoblots for ANF, β-MHC, and MLC-2 are shown. β-tubulin Ab was used as a loading control. Data in bar graphs are mean ± SD for 5 samples per group (*P < 0.05).
Figure 3
Figure 3. MAPK signaling is activated in hearts and isolated cardiomyocytes from Lmna H222P mice.
(A) Detection of phosphorylated JNK (pJNK) and ERK1/2 (pERK1/2) in hearts and isolated cardiomyocytes from Lmna+/+, LmnaH222P/+, and LmnaH222P/H222P mice. JNK and ERK1/2 were measured by immunoblotting with Abs against total protein (JNK and ERK1/2) and phosphoprotein (pJNK and pERK1/2). Data in bar graphs are mean ± SD of 5 samples per group (*P < 0.05, ***P < 0.0005). (B) Effect of MAPK activation on downstream targets in Lmna+/+, LmnaH222P/+, and LmnaH222P/H222P mice. Representative immunoblots using Abs that recognize phosphorylated c-Jun (pc-Jun), Elk1, and bcl-2 and β-tubulin as a loading control are shown for proteins extracted from heart tissue and isolated ventricular cardiomyocytes.
Figure 4
Figure 4. Immunofluorescence microscopic analysis of pERK1/2 in heart sections from LmnaH222P/H222P mice.
(A) Sections of frozen heart from Lmna+/+ (top panel) and LmnaH222P/H222P (bottom panel) mice were analyzed by immunofluorescence microscopy using Ab recognizing pERK1/2. Sections were counterstained with DAPI. Scale bars: 50 μm. (B) Quantification of pERK1/2 labeling in cardiomyocytes from Lmna+/+ mice and LmnaH222P/H222P mice. Cardiomyocytes are delimited by dotted line and intensity of emitted fluorescence is measured along the yellow line (a to b). Position of the nucleus and intensity of fluorescence using anti pERK1/2 Ab is shown in the diagram of a single cardiomyocyte. (C) Bars indicate intensity of pERK1/2 fluorescence in the nucleus of Lmna+/+ and LmnaH222P/H222P cardiomyocytes. Values are mean ± SD from 90 cardiomyocytes from 2 different hearts per group (*P < 0.05).
Figure 5
Figure 5. Expression of c-Jun, Elk1, JunD, and Elk4 in various tissues from 10-week-old Lmna+/+ and LmnaH222P/H222P mice.
Summary of real-time PCR results in heart, skeletal muscle (sk. muscle), lung, spleen, and bladder are shown. Bars indicate the fold overexpression of the indicated mRNA normalized to Gapdh as calculated by the ΔδCT method. Values are mean ± SD for 6 samples per group (*P < 0.05, **P < 0.005).
Figure 6
Figure 6. Time-course expression of genes activated by MAPK in hearts from LmnaH222P/H222P mice at 4, 7, and 10 weeks of age.
Expression of Myl7, Vegf, Sln, c-Jun, Elk1, JunD, and Elk4 in hearts of Lmna+/+ and LmnaH222P/H222P mice is shown. Bars indicate the fold overexpression of the indicated mRNA normalized to Gapdh as calculated by the ΔδCT method. Values are mean ± SD for 6 samples per group (*P < 0.05, **P < 0.005).
Figure 7
Figure 7. Expression of H222P Lamin A in transfected Cos-7 and C2C12 cells leads to increased phosphorylation and enhanced nuclear translocation of ERK1/2.
(A and B) Effect of H222P Lamin A expression on levels of pERK1/2 in transfected Cos-7 (A) and C2C12 (B) cells. Immunoblotting with pERK1/2 Ab and total ERK1/2 Ab was performed. Data are shown as mean ± SD of 11 (A) and 7 (B) samples per group (*P < 0.05). Significance of the results was determined using paired Student’s t test (for parametric data) and a Wilcoxon rank-sum test (for nonparametric data). Immunoblotting with GFP Ab is shown to demonstrate expression of proteins encoded by transfected plasmids. Immunoblotting with β-actin Ab was used as a loading control. (C and D) Effect of H222P Lamin A on nuclear translocation of pERK1/2 in transfected Cos-7 (C) and C2C12 (D) cells. Representative photomicrographs are shown for nontransfected (NT) cells, transfected cells expressing a GFP fusion of wild-type Lamin A, and transfected cells expressing a GFP fusion of Lamin A with the H222P amino acid substitution. Arrowheads show enhanced nuclear localization of pERK1/2 in cells expressing GFP H222P Lamin A. Scale bars: 10 μm. (E and F) Percentage of Cos-7 (E) and C2C12 (F) cells with pERK1/2 primarily in the nucleus. Nontransfected cells, transfected cells expressing a GFP fusion of wild-type Lamin A, and transfected cells expressing a GFP fusion of Lamin A with the H222P aa substitution were randomly counted and scored for nuclear pERK1/2 (see arrowheads in C for example). Transfected cells were determined by presence of GFP signal. Values are mean ± SD for 200 cells per group (*P < 0.05). The person counting the cells was blinded as to which protein was expressed.
Figure 8
Figure 8. Activation of c-Jun and Elk1 by expression of Lamin A mutants.
Cos-7 cells were transiently transfected with plasmids encoding wild-type Lamin A, Lamin A with the indicated amino acid substitution and the associated phenotype to each mutation (e.g., EDMD or familial partial lipodystrophy [FPLD]), or empty vector control. After 24 hours, luciferase activities induced by expression of c-Jun and Elk1 were measured in cell lysates and normalized to β-gal activities obtained from a protein encoded by a cotransfected plasmid. Results are mean ± SD of 5 experiments (*P < 0.05, **P < 0.005).
Figure 9
Figure 9. Model of how abnormalities of A-type lamins in the nuclear lamina may lead to cardiomyopathy.
Abnormalities of A-type lamins in the nuclear lamina activate MAPK cascades, possibly via heterotrimeric G-protein receptors or by inducing stress responses by unknown mechanisms (?). This leads to activation of G-proteins (RAS and RAC), protein kinase (RAF), and subsequent enhanced phosphorylation of ERK and JNK1/2, resulting in nuclear translocation. In the nucleus, pERK1/2 and pJNK activate transcription factors such as Elk1, bcl-2, JunD, c-Jun, and Elk4, leading to increased synthesis of these proteins. Increased amounts and activities of transcription factors activated by pJNK and pERK1/2 alter expression of other genes, some encoding components of muscle fibers and sarcomeres. Aberrant expression of these proteins leads to development of cardiomyopathy.

References

    1. Emery A.E.H. Emery-Dreifuss muscular dystrophy — a 40 year retrospective. Neuromusc. Disord. . 2000;10:228–232. - PubMed
    1. Bione S., et al. Identification of a novel X-linked gene responsible for Emery-Dreifuss muscular dystrophy. Nat. Genet. . 1994;8:323–327. - PubMed
    1. Manilal S., Nguyen T.M., Sewry C.A., Morris G.E. The Emery-Dreifuss muscular dystrophy protein, emerin, is a nuclear membrane protein. Hum. Mol. Genet. . 1996;5:801–808. - PubMed
    1. Nagano A., et al. Emerin deficiency at the nuclear membrane in patients with Emery-Dreifuss muscular dystrophy. Nat. Genet. . 1996;12:254–259. - PubMed
    1. Bonne G., et al. Mutations in the gene encoding lamin A/C cause autosomal dominant Emery-Dreifuss muscular dystrophy. Nat. Genet. . 1999;21:285–288. - PubMed

Publication types

Substances