. 2007 Jun 20;502(6):1079-97.
doi: 10.1002/cne.21362.

Axonal regeneration and development of de novo axons from distal dendrites of adult feline commissural interneurons after a proximal axotomy

Affiliations

Axonal regeneration and development of de novo axons from distal dendrites of adult feline commissural interneurons after a proximal axotomy

Keith K Fenrich et al. J Comp Neurol. .

Abstract

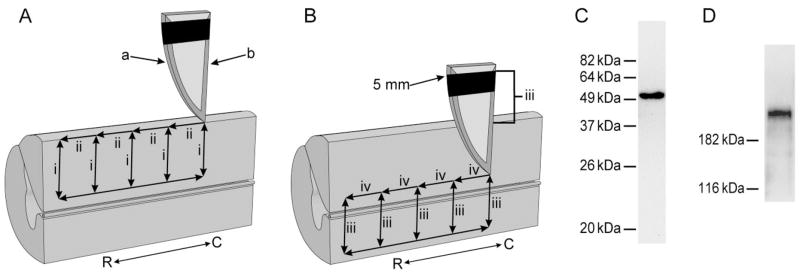
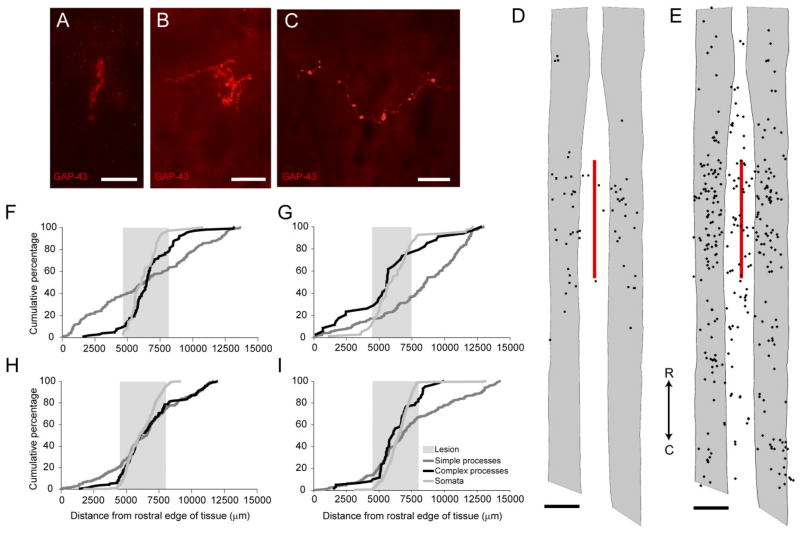
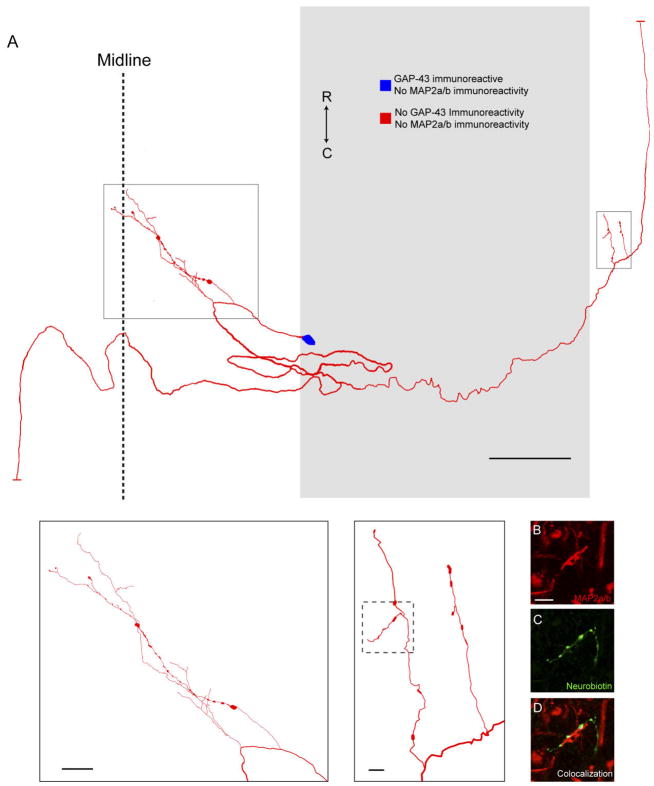
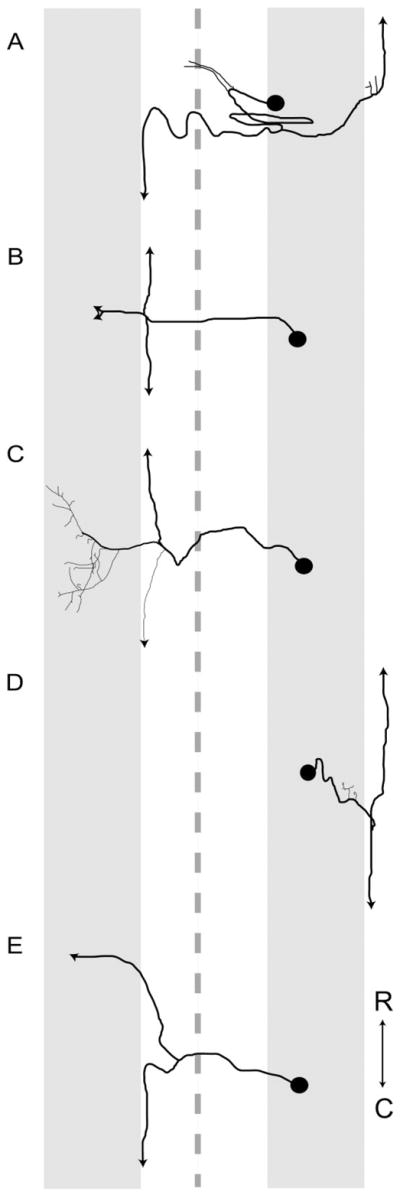
Following proximal axotomy, several types of neurons sprout de novo axons from distal dendrites. These processes may represent a means of forming new circuits following spinal cord injury. However, it is not know whether mammalian spinal interneurons, axotomized as a result of a spinal cord injury, develop de novo axons. Our goal was to determine whether spinal commissural interneurons (CINs), axotomized by 3-4-mm midsagittal transection at C3, form de novo axons from distal dendrites. All experiments were performed on adult cats. CINs in C3 were stained with extracellular injections of Neurobiotin at 4-5 weeks post injury. The somata of axotomized CINs were identified by the presence of immunoreactivity for the axonal growth-associated protein-43 (GAP-43). Nearly half of the CINs had de novo axons that emerged from distal dendrites. These axons lacked immunoreactivity for the dendritic protein, microtubule-associated protein2a/b (MAP2a/b); some had GAP-43-immunoreactive terminals; and nearly all had morphological features typical of axons. Dendrites of other CINs did not give rise to de novo axons. These CINs did, however, each have a long axon-like process (L-ALP) that projected directly from the soma or a very proximal dendrite. L-ALPs were devoid of MAP2a/b immunoreactivity. Some of these L-ALPs projected through the lesion and formed bouton-like swellings. These results suggest that proximally axotomized spinal interneurons have the potential to form new connections via de novo axons that emerge from distal dendrites. Others may be capable of regeneration of their original axon.


Figures

Fig. 1
Fig. 1
Schematic diagrams of the lesion protocol and Western blot analysis of GAP-43 and MAP2a/b antibodies. A,B: Lesion protocol. All lesions began caudally (right) and ended rostrally (left). The leading edge of the blade (a) was hand sharpened, and the trailing edge (b) was the manufacturer’s edge. The 5-mm mark was measured from the tip of the blade, along the manufacturer’s edge and was perpendicular to the manufacturer’s edge. A: The trajectories of the first series of penetrations and cuts. Each penetration (i) was 2.5 mm deep, and each rostral movement (ii) was 0.75 mm long. B: The trajectories of the second series of penetrations and cuts. Starting at 2.5 mm deep, each penetration (iii) was the distance from 2.5 mm depth until the black mark on the blade disappeared below the surface of the spinal cord, and each cut (iv) was 0.75 mm long. R, rostral; C, caudal. C,D: Western blots of GAP-43 antibodies (C) and MAP2a/b antibodies (D). Molecular weight standards (Invitrogen, La Jolla, CA, cat. no. 10748-010) are indicated on the left.
Fig. 2
Fig. 2
Rostral-caudal distribution of Neurobiotin-labeled processes and MAP2a/b-immunoreactive dendrites that crossed the mid-line near five lesions, as seen in non-recovery experiments. A: Distribution of Neurobiotin-labeled processes based on one experiment. The distribution of Neurobiotin-labeled processes was reconstructed from serial histological sections that contained the commissures (n = 10–13 sections per experiment). Each section was reconstructed by tracing the section outline, marking the location of the injection sites, and tracing all processes with medial-lateral projections near the midline. These reconstructions were superimposed and aligned by matching the injection sites and the outlines of the reconstructions. The injection sites are indicated by Xs. The Neurobiotin-labeled processes are indicated by the lines immediately below the injection sites. The outer lines indicate the edges of the tissue sections. The dashed gray line indicates the midline. The gray shaded area indicates the rostral-caudal region in which there were no Neurobiotin-labeled processes that crossed the midline. B–F: Histograms of the distribution of MAP2a/b-immunoreactive processes and Neurobiotin-labeled processes that crossed the midline in the vicinity of midsagittal lesions. Results from all five experiments are shown. The frequency of MAP2a/b-immunoreactive processes along the midline is expressed as the number of pixels (black bars) that were immunoreactive for MAP2a/b along a line that followed the midline. All sections that contained the commissures were examined. MAP2a/b immunoreactivity was quantified by using Image Pro Plus. Only those pixels that exceeded the fluorescent intensity of the average fluorescence intensity of several isolated dendrites elsewhere on the section were considered to be MAP2a/b immunoreactive. The gray shaded areas indicate the regions in which no Neurobiotin-stained processes crossed the midline, as determined by the method illustrated in A. In the experiments illustrated in B, E, and F, the rostral-caudal axis of the spinal cord was not parallel to the trajectory of the knife cut. To avoid a superficial cut at one end of the transection and hitting bone at the other end of the transection, the knife cuts were limited to a length of 2 mm. The results shown in B are from the same experiment illustrated in A. R, rostral; C, caudal.
Fig. 3
Fig. 3
Distribution of GAP-43-immunoreactive somata. A: Epifluorescence photomicrographs ofGAP-43-immunoreactive somata. Red indicates GAP-43 immunoreactivity. B: Enlarged image of the right soma shown in A. C,D: Transverse views of the locations of GAP-43-immunoreactive somata. Dots indicate the location of GAP-43-immunoreactive somata from a 10-day survival experiment in which the cut traversed the left ventral horn (C) and an 8-week survival experiment in which the cut transected the commissures through the midline (D). The path of the lesion, as defined by a series of holes and a disruption in the continuity of the gray and white matter, is indicated by the red line. E: Horizontal view of the location of GAP-43-immunoreactive somata 8 weeks following the lesion. R, rostral; C, caudal; dots: locations of GAP-43-immunoreactive somata; gray areas: the location of the gray matter from a representative section; red line: the location of the lesion as defined by the length of the knife cut and placed such that it had the greatest number of GAP-43-immunoreactive somata within its rostral-caudal confines. F: Cumulative histograms of the distribution of GAP-43-immunoreactive somata based on data from four experiments: two at 10 days post lesion and two at 8 weeks post lesion. The rostral-caudal distribution of the somata was normalized to the length to the lesion (i.e., length of the knife cut; gray shaded area) and centered with the greatest number of GAP-43-immunoreactive somata within the gray shaded area. Scale bar = 25 μm in A,B; 1,000 μm in E.
Fig. 4
Fig. 4
Morphological characteristics and distribution of GAP-43-immunoreactive processes. A–C: Epifluorescence photomicrographs of simple (A) and complex (B and C) GAP-43-immunoreactive processes. Red indicates GAP-43 immunoreactivity. D,E: Distribution of complex (D) and simple (E) GAP-43-immunoreactive processes in the horizontal plane. Based on the same experiment shown in Figure 3D. R, rostral; C, caudal; gray areas: the location of the gray matter from a single representative section; red lines: the location of the lesion as defined by the length of the knife cut and placed such that it had the greatest number of GAP-43-immunoreactive somata within its rostral-caudal confines. F–I: Cumulative histograms comparing distributions of GAP-43-immunoreactive somata and simple and complex processes as a function of the distance from the rostral edge of the tissue. F,G: Distributions of GAP-43-immunoreactive somata and processes from two 10-day survival experiments. H,I: Distributions of GAP-43-immunoreactive somata and processes from two 8-week survival experiments. The gray boxes indicate the length and location of the lesion. The widths of the gray boxes are equivalent to the lengths of the knife cut and are centered with the greatest number of GAP-43-immunoreactive somata within the gray shaded areas. Scale bar = 25 μm in A–C; 1,000 μm in D,E.
Fig. 5
Fig. 5
Partial reconstructions of two de novo axons that emerged from distal dendrites and were GAP-43 immunoreactive. Both reconstructions are shown in the horizontal plane. Distribution of GAP-43 and MAP2a/b immunoreactivity is indicated by the color of the reconstruction (see legend). Dashed lines indicate the origins of other dendritic branches that are not shown. The insets show higher magnification drawings of the de novo axons. A: A de novo axon that emerged from a distal dendrite and had an elongated terminal varicosity. This varicosity was GAP-43 immunoreactive. Confocal microscopic images of the regions within the dashed boxes are shown in Figure 6. B: A de novo axon that emerged from a distal dendrite and had two bifurcations and three terminal varicosities, two of which were GAP-43 immunoreactive. R, rostral; C, caudal; M, medial; L, lateral. Scale bar = 50 μm; in A,B; 10 μm in insets to A,B.
Fig. 6
Fig. 6
Distribution of GAP-43 and MAP2a/b immunoreactivity in de novo axons that emerged from distal dendrites. A,B; D,E: Confocal microscopic images of GAP-43 immunoreactivity (A), MAP2a/b immunoreactivity (D), and Neurobiotin staining (B,E) of the termination of a de novo axon that emerged from a distal dendrite (upper dashed box in Fig. 5A). G,H: Confocal microscopic images of MAP2a/b immunoreactivity (G) and Neurobiotin staining (H) of a proximal dendrite (lower dashed box in Fig. 5A). C,F,I: Computer-generated overlays of A and B, D and E, and G and H, respectively. White pixels indicate regions with double labeling. Scale bar = 10 μm in A–I.
Fig. 7
Fig. 7
A: Partial reconstruction, shown in the horizontal plane, of two de novo axons that emerged from distal dendrites and lacked immunoreactivity for both MAP2a/b and GAP-43. Both de novo axons originated from the same primary dendrite. Distribution of GAP-43 and MAP2a/b immunoreactivity is indicated by the color of the reconstruction (see legend). Dashed lines indicate the origins of other dendritic branches that are not shown. The insets show higher magnification drawings of the entire upper de novo axon (left inset) and the terminal of the lower de novo axon (right inset). B,C: Confocal microscopic images of MAP2a/b immunoreactivity (B) and Neurobiotin staining (C) of the region within the dashed box in the right inset of A. D: Computer-generated overlay of B and C showing synapse-like contacts between the de novo axon and adjacent dendrites. The white pixels indicate double-labeled regions due to synaptic-like contacts between swellings on the de novo axon and dendrites. R, rostral; C, caudal; M, medial; L, lateral. Scale bar = 50 μm; in A; 10 μm in B (applies to B–D), inset to A.
Fig. 8
Fig. 8
Partial reconstructions of three de novo axons that emerged from distal dendrites and lacked immunoreactivity for both MAP2a/b and GAP-43. Both reconstructions are shown in the horizontal plane. Distribution of GAP-43 and MAP2a/b immunoreactivity is indicated by the color of the reconstruction (see legend). Dashed lines indicate the origins of other dendritic branches that are not shown. The insets show higher magnification drawings of the de novo axons. A: An example of a de novo axon that emerged from a distal dendrite and whose morphology resembled the structure of the MAP2a/b-immunoreactive dendrite from which it emerged. B: Two de novo axons with multiple right-angled branches and varicosities, which emerged from a dendrite lacking MAP2a/b immunoreactivity. Arrowheads indicate the points at which the proximal processes ceased to have a dendritic morphology. These points were considered to be start of the de novo axons. Arrow indicates the path of the de novo axon that starts at the lower arrowhead. R, rostral; C, caudal; M, medial; L, lateral. Scale bar = 50 μm; in A,B; 10 μm in insets to A,B.
Fig. 9
Fig. 9
A: Partial reconstruction, shown in the horizontal plane, of an L-ALP that projected to both sides of the spinal cord. For clarity, the dendrites are not shown. Gray area represents the location of the gray matter as seen at the dorsal-ventral level of the soma. The rostrally and caudally projecting branches of the L-ALP in the white matter extended beyond the region shown in this reconstruction. Distribution of GAP-43 and MAP2a/b immunoreactivity is indicated by the color of the reconstruction (see legend). The insets show higher magnification drawings of fine-diameter branches that emerged from the L-ALP. B,C: Confocal microscopic images of MAP2a/b immunoreactivity (B) and Neurobiotin staining (C) of the region within the dashed box. D: Computer-generated overlay of B and C. The white pixels indicate double-labeled regions due to synaptic-like contacts between swellings on the L-ALP and dendrites. R, rostral; C, caudal. Scale bar = 250 μm; in A; 20 μm; in left inset to A; 10 μm in B (applies to B–D) and right inset to A.
Fig. 10
Fig. 10
Schematic summary of reconstructed L-ALPs. A–C: L-ALPs reconstructed from experiment shown in Figure 11A,C. D,E: L-ALPs reconstructed from experiments shown in Figure 11B,D. Black circles represent somata. Gray shaded areas represent the ventral gray matter. Dashed line represents the midline. R, rostral; C, caudal.
Fig. 11
Fig. 11
Rostral-caudal location of L-ALPs that crossed the mid-line relative to the distribution of dendrites that crossed the midline and the distribution of GAP-43-immunoreactive somata. Data from two experiments are shown. A,B: The distribution of MAP2a/b-immunoreactive processes that crossed the midline. The methods used to construct these histograms are identical to those used in Figure 2. Three of the four reconstructed L-ALPs that crossed the midline were found in the experiment shown in A. These L-ALPs crossed the midline in a narrow rostral-caudal band, 100 μm long. The position of this band is indicated by the arrow. The remaining reconstructed L-ALP that crossed the midline was found in the experiment shown in B. The arrow indicates the location at which this L-ALP crossed the midline. C,D: Cumulative histograms of the rostral-caudal distribution of GAP-43-immunoreactive somata from the experiments shown in A and B, respectively. The gray boxes indicate the length and location of the lesion. The widths of the gray boxes are equivalent to the lengths of the knife cut and are centered with the greatest number of GAP-43-immunoreactive somata within the gray shaded areas. The arrows indicate the locations at which the L-ALPs crossed the midline.

Similar articles

Cited by

References

    1. Bareyre FM, Kerschensteiner M, Raineteau O, Mettenleiter TC, Weinmann O, Schwab ME. The injured spinal cord spontaneously forms a new intraspinal circuit in adult rats. Nat Neurosci. 2004;7:269–277. - PubMed
    1. Bolton PS, Goto T, Wilson VJ. Commissural neurons in the cat upper cervical spinal cord. Neuroreport. 1991;2:743–746. - PubMed
    1. Bury SD, Jones TA. Unilateral sensorimotor cortex lesions in adult rats facilitate motor skill learning with the “unaffected” forelimb and training-induced dendritic structural plasticity in the motor cortex. J Neurosci. 2002;22:8597–8606. - PMC - PubMed
    1. Cho EY, So KF. Characterization of the sprouting response of axon-like processes from retinal ganglion cells after axotomy in adult hamsters: a model using intravitreal implantation of a peripheral nerve. J Neurocytol. 1992;21:589–603. - PubMed
    1. Coblentz FE, Radeke MJ, Lewis GP, Fisher SK. Evidence that ganglion cells react to retinal detachment. Exp Eye Res. 2003;76:333–342. - PubMed

Publication types

MeSH terms