

Multiple controls regulate the expression of mobE, an HNH homing endonuclease gene embedded within a ribonucleotide reductase gene of phage Aeh1
- PMID: 17449612
- PMCID: PMC1913452
- DOI: 10.1128/JB.00321-07
Multiple controls regulate the expression of mobE, an HNH homing endonuclease gene embedded within a ribonucleotide reductase gene of phage Aeh1
Abstract
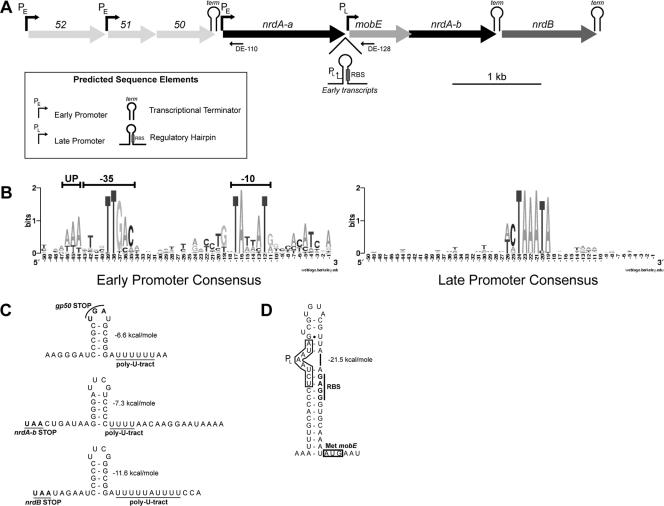
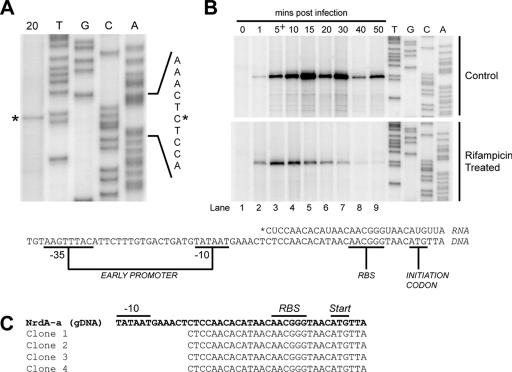
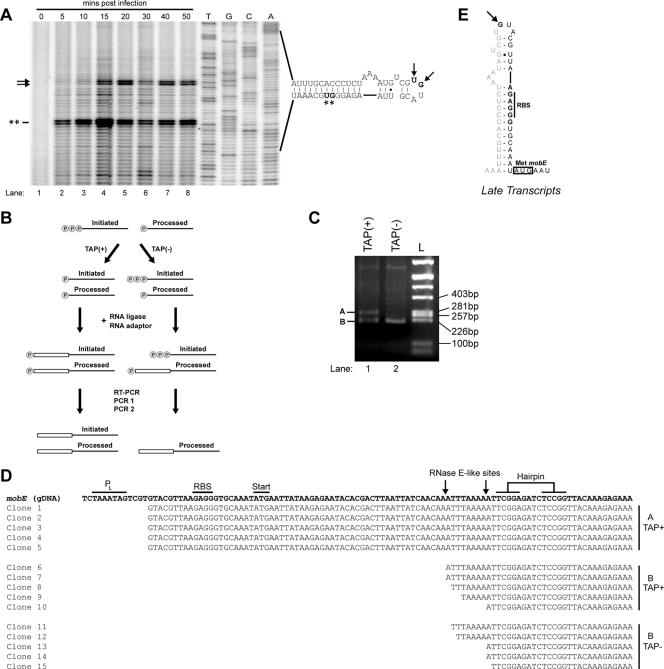
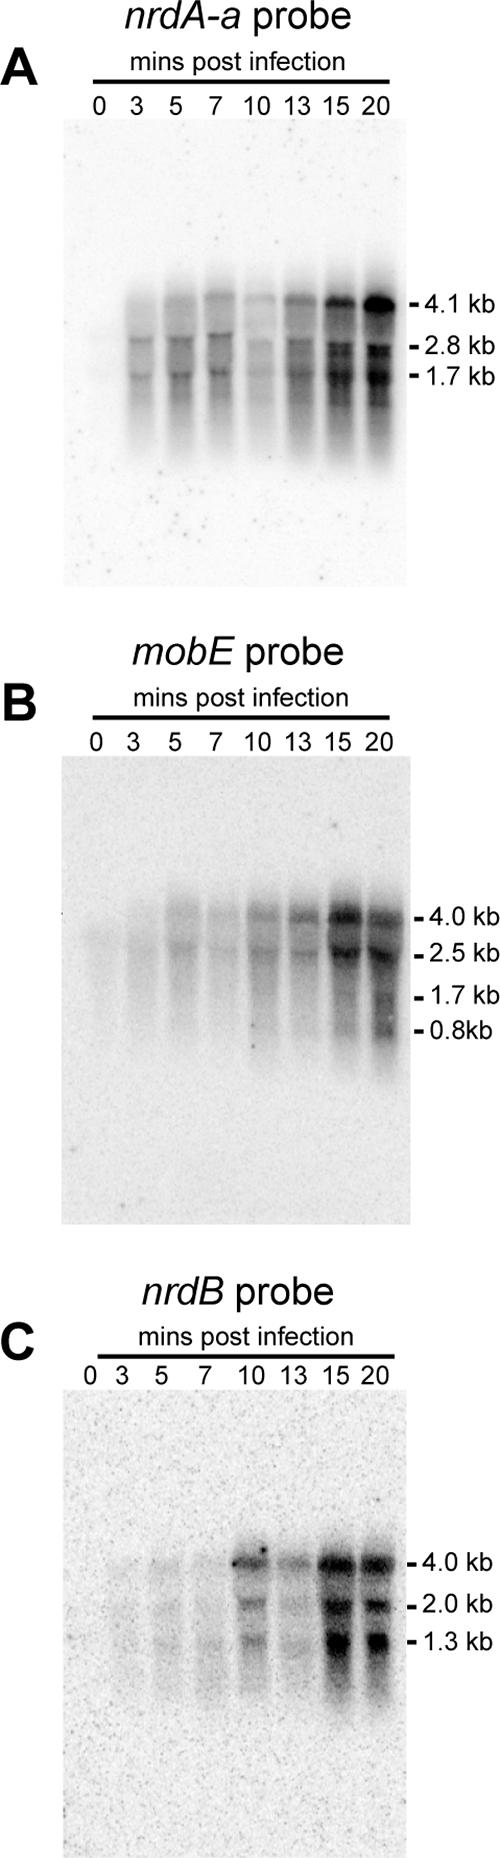
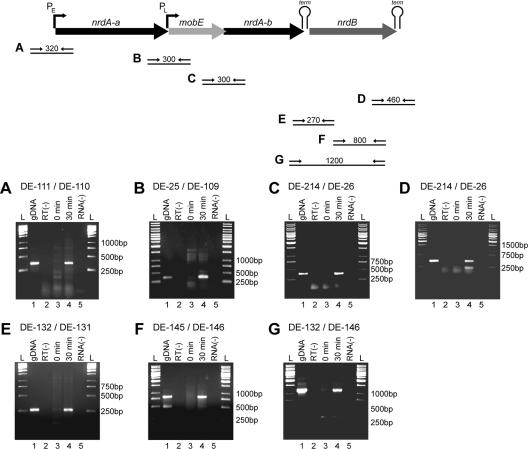
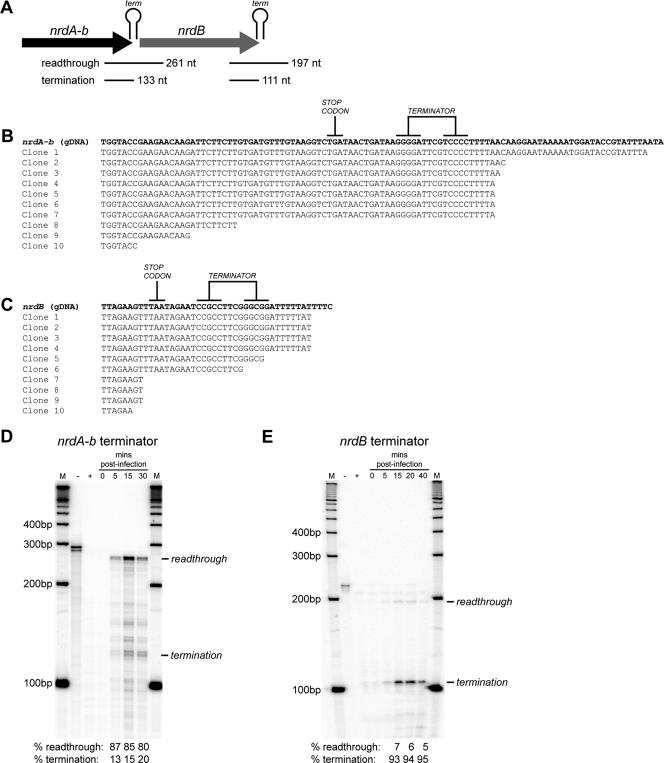
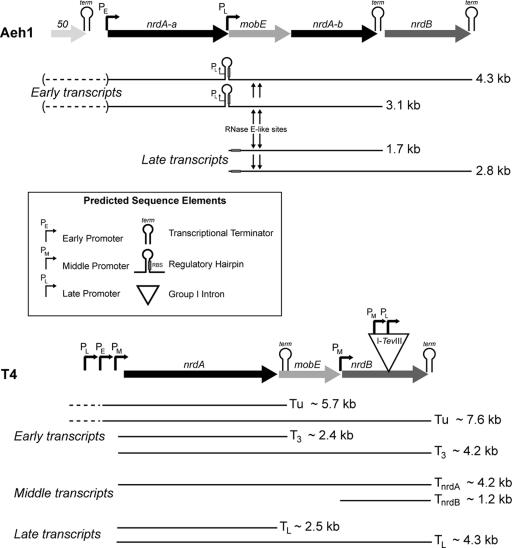
Mobile genetic elements have the potential to influence the expression of genes surrounding their insertion site upon invasion of a genome. Here, we examine the transcriptional organization of a ribonucleotide reductase operon (nrd) that has been invaded by an HNH family homing endonuclease, mobE. In Aeromonas hydrophila phage Aeh1, mobE has inserted into the large-subunit gene (nrdA) of aerobic ribonucleotide reductase (RNR), splitting it into two smaller genes, nrdA-a and nrdA-b. This gene organization differs from that in phages T4, T6, RB2, RB3, RB15, and LZ7, where mobE is inserted in the nrdA-nrdB intergenic region. We present evidence that the expression of Aeh1 mobE is regulated by transcriptional, posttranscriptional, and translational controls. An Aeh1-specific late promoter drives expression of mobE, but strikingly the mobE transcript is processed internally at an RNase E-like site. We also identified a putative stem-loop structure upstream of mobE that sequesters the mobE ribosome binding site, presumably acting to down regulate MobE translation. Moreover, our transcriptional analyses indicate that the surrounding nrd genes of phage Aeh1 are expressed by a different strategy than are the corresponding phage T4 genes and that transcriptional readthrough is the only mechanism by which the promoterless Aeh1 nrdB gene is expressed. We suggest that the occurrence of multiple layers of control to limit the expression of mobE to late in the Aeh1 infection cycle is an adaptation of Aeh1 to reduce any effects on expression of the surrounding nrd genes early in phage infection when RNR function is critical.
Figures
Similar articles
-
An RNA hairpin sequesters the ribosome binding site of the homing endonuclease mobE gene.J Bacteriol. 2009 Apr;191(7):2409-13. doi: 10.1128/JB.01751-08. Epub 2009 Jan 30. J Bacteriol. 2009. PMID: 19181807 Free PMC article.
-
Insertion of a homing endonuclease creates a genes-in-pieces ribonucleotide reductase that retains function.Proc Natl Acad Sci U S A. 2007 Apr 10;104(15):6176-81. doi: 10.1073/pnas.0609915104. Epub 2007 Mar 29. Proc Natl Acad Sci U S A. 2007. PMID: 17395719 Free PMC article.
-
Studies on synonymous codon and amino acid usages in Aeromonas hydrophila phage Aeh1: architecture of protein-coding genes and therapeutic implications.J Microbiol Immunol Infect. 2007 Feb;40(1):24-33. J Microbiol Immunol Infect. 2007. PMID: 17332903
-
Mobile DNA elements in T4 and related phages.Virol J. 2010 Oct 28;7:290. doi: 10.1186/1743-422X-7-290. Virol J. 2010. PMID: 21029434 Free PMC article. Review.
-
Sequence-specific DNA nicking endonucleases.Biomol Concepts. 2015 Aug;6(4):253-67. doi: 10.1515/bmc-2015-0016. Biomol Concepts. 2015. PMID: 26352356 Review.
Cited by
-
A Novel, Highly Related Jumbo Family of Bacteriophages That Were Isolated Against Erwinia.Front Microbiol. 2019 Jul 23;10:1533. doi: 10.3389/fmicb.2019.01533. eCollection 2019. Front Microbiol. 2019. PMID: 31428059 Free PMC article.
-
Genomic Characterization of the Novel Aeromonas hydrophila Phage Ahp1 Suggests the Derivation of a New Subgroup from phiKMV-Like Family.PLoS One. 2016 Sep 7;11(9):e0162060. doi: 10.1371/journal.pone.0162060. eCollection 2016. PLoS One. 2016. PMID: 27603936 Free PMC article.
-
An RNA hairpin sequesters the ribosome binding site of the homing endonuclease mobE gene.J Bacteriol. 2009 Apr;191(7):2409-13. doi: 10.1128/JB.01751-08. Epub 2009 Jan 30. J Bacteriol. 2009. PMID: 19181807 Free PMC article.
-
First Characterization of a Hafnia Phage Reveals Extraordinarily Large Burst Size and Unusual Plaque Polymorphism.Front Microbiol. 2022 Feb 8;12:754331. doi: 10.3389/fmicb.2021.754331. eCollection 2021. Front Microbiol. 2022. PMID: 35211099 Free PMC article.
-
Complete genome analysis of bacteriophage EFC1 infecting Enterococcus faecalis from chicken.Arch Microbiol. 2022 Jun 22;204(7):413. doi: 10.1007/s00203-022-02838-5. Arch Microbiol. 2022. PMID: 35732959
References
-
- Abe, H., T. Abo, and H. Aiba. 1999. Regulation of intrinsic terminator by translation in Escherichia coli: transcription termination at a distance downstream. Genes Cells 4:87-97. - PubMed
-
- Abe, H., and H. Aiba. 1996. Differential contributions of two elements of rho-independent terminator to transcription termination and mRNA stabilization. Biochimie 78:1035-1042. - PubMed
-
- Belfort, M., V. Derbyshire, B. Cousineau, and A. Lambowitz. 2002. Mobile introns: pathways and proteins, p. 761-783. In N. Craig, R. Craigie, M. Gellert, and A. Lambowitz (ed.), Mobile DNA II. ASM Press, Washington, DC.
Publication types
MeSH terms
Substances
LinkOut - more resources
Full Text Sources
