

Developmental genes have pleiotropic effects on plant morphology and source capacity, eventually impacting on seed protein content and productivity in pea
- PMID: 17449650
- PMCID: PMC1914171
- DOI: 10.1104/pp.107.096966
Developmental genes have pleiotropic effects on plant morphology and source capacity, eventually impacting on seed protein content and productivity in pea
Abstract
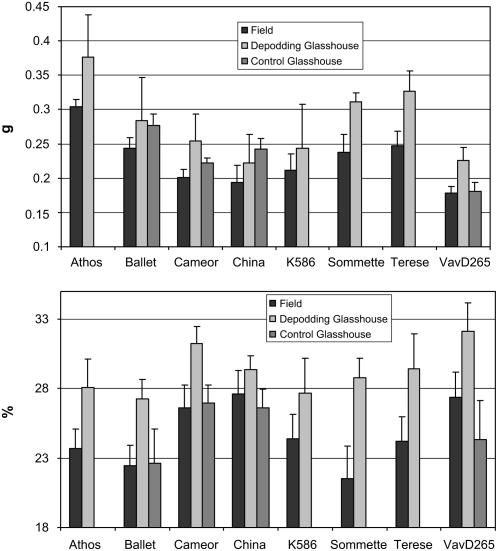
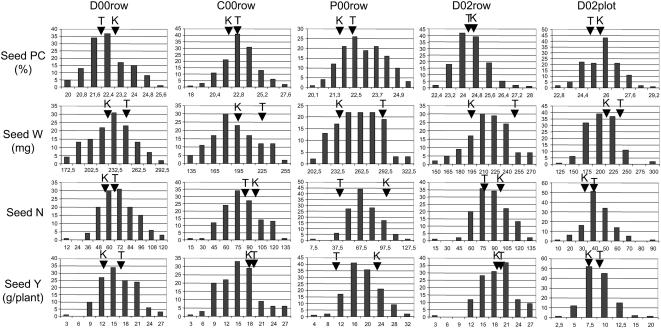
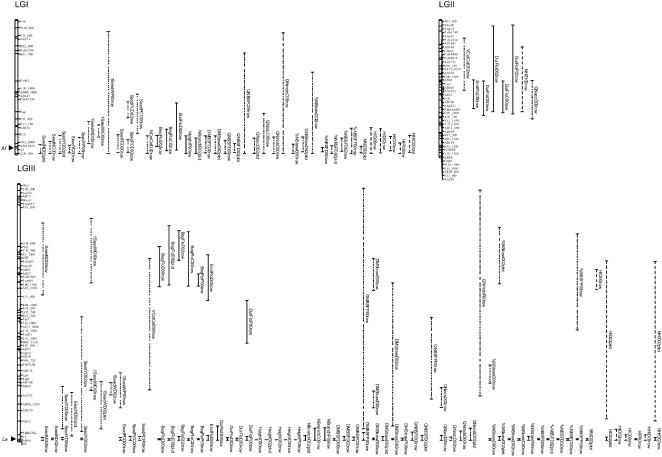
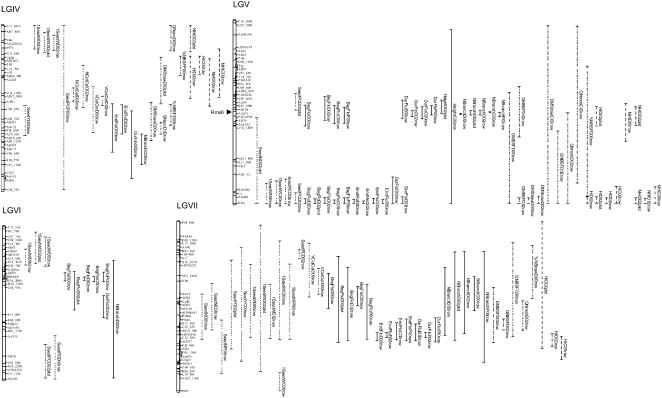
Increasing pea (Pisum sativum) seed nutritional value and particularly seed protein content, while maintaining yield, is an important challenge for further development of this crop. Seed protein content and yield are complex and unstable traits, integrating all the processes occurring during the plant life cycle. During filling, seeds are the main sink to which assimilates are preferentially allocated at the expense of vegetative organs. Nitrogen seed demand is satisfied partly by nitrogen acquired by the roots, but also by nitrogen remobilized from vegetative organs. In this study, we evaluated the respective roles of nitrogen source capacity and sink strength in the genetic variability of seed protein content and yield. We showed in eight genotypes of diverse origins that both the maximal rate of nitrogen accumulation in the seeds and nitrogen source capacity varied among genotypes. Then, to identify the genetic factors responsible for seed protein content and yield variation, we searched for quantitative trait loci (QTL) for seed traits and for indicators of sink strength and source nitrogen capacity. We detected 261 QTL across five environments for all traits measured. Most QTL for seed and plant traits mapped in clusters, raising the possibility of common underlying processes and candidate genes. In most environments, the genes Le and Afila, which control internode length and the switch between leaflets and tendrils, respectively, determined plant nitrogen status. Depending on the environment, these genes were linked to QTL of seed protein content and yield, suggesting that source-sink adjustments depend on growing conditions.
Figures
References
-
- Abbo S, Molina C, Jngmann R, Grusak MA, Berkovitch Z, Kahl G, Winter P, Reifen R (2005) Quantitative trait loci governing carotenoid concentration and weight in seeds of chickpea (Cicer arietinum L.). Theor Appl Genet 111 185–195 - PubMed
-
- Ait-Ali T, Swain SM, Reid JB, Sun T, Kamiya Y (1997) The LS locus of pea encodes the gibberellin biosynthesis enzyme ent-kaurene synthase A. Plant J 11 443–454 - PubMed
-
- Arcade A, Labourdette A, Falque M, Mangin B, Chardon F, Charcosset A, Joets J (2004) BioMercator: integrating genetic maps and QTL towards discovery of candidate genes. Bioinformatics 20 2324–2326 - PubMed
-
- Atta S, Maltese S, Cousin R (2004) Protein content and dry weight of seeds from various pea genotypes. Agronomie 24 257–266
-
- Aubert G, Morin J, Jacquin F, Loridon K, Quillet MC, Petit A, Rameau C, Lejeune-Hénaut I, Huguet T, Burstin J (2006) Functional mapping in pea, as an aid to the candidate gene approach and for investigating the synteny with the model species Medicago truncatula. Theor Appl Genet 112 1024–1041 - PubMed
Publication types
MeSH terms
Substances
LinkOut - more resources
Full Text Sources
