. 2007 Jul 15;93(2):505-12.
doi: 10.1529/biophysj.106.101048. Epub 2007 Apr 20.

The stoichiometry of P2X2/6 receptor heteromers depends on relative subunit expression levels

Affiliations

The stoichiometry of P2X2/6 receptor heteromers depends on relative subunit expression levels

Nelson P Barrera et al. Biophys J. .

Abstract

Fast synaptic transmission involves the operation of ionotropic receptors, which are often composed of at least two types of subunit. We have developed a method, based on atomic force microscopy imaging to determine the stoichiometry and subunit arrangement within ionotropic receptors. We showed recently that the P2X(2) receptor for ATP is expressed as a trimer but that the P2X(6) subunit is unable to oligomerize. In this study we addressed the subunit stoichiometry of heteromers containing both P2X(2) and P2X(6) subunits. We transfected tsA 201 cells with both P2X(2) and P2X(6) subunits, bearing different epitope tags. We manipulated the transfection conditions so that either P2X(2) or P2X(6) was the predominant subunit expressed. By atomic force microscopy imaging of isolated receptors decorated with antiepitope antibodies, we demonstrate that when expression of the P2X(2) subunit predominates, the receptors contain primarily 2 x P2X(2) subunits and 1 x P2X(6) subunit. In contrast, when the P2X(6) subunit predominates, the subunit stoichiometry of the receptors is reversed. Our results show that the composition of P2X receptor heteromers is plastic and dependent on the relative subunit expression levels. We suggest that this property of receptor assembly might introduce an additional layer of subtlety into P2X receptor signaling.


Figures
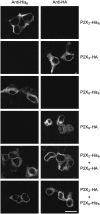
FIGURE 1
FIGURE 1
Immunofluorescence analysis of receptors. Cells were fixed with paraformaldehyde (4%), permeabilized with saponin, and incubated with appropriate monoclonal primary antibodies, followed by a Cy3-conjugated goat anti-mouse secondary antibody. Cells were imaged by confocal laser scanning microscopy. Scale bar, 20 μm.
FIGURE 2
FIGURE 2
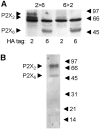
Immunoblot analysis of P2X2/6 receptors. (A) Detection of receptors in crude membrane fractions of tsA 201 cells. Cells were transfected with cDNA encoding either P2X2-HA plus P2X6-His6 or P2X2-His6 plus P2X6-HA, at the same DNA ratios (1:1 P2X2/P2X6 for the left two lanes and 1:4 P2X2/P2X6 for the right two lanes). A crude membrane fraction was then prepared from each population of cells, and an equivalent amount of each fraction was subjected to SDS-polyacrylamide gel electrophoresis and immunoblotting using the anti-HA antibody followed by a horseradish peroxidase-conjugated goat anti-mouse secondary antibody. Immunoreactive bands were visualized using enhanced chemiluminescence. The positions of the P2X2 (70/64 kDa) and the P2X6 subunit (52 kDa) are indicated on the left. Note the presence of a nonspecific band running at 60 kDa in all lanes. The positions of molecular mass markers (kDa) are indicated on the right. (B) Detection of receptors in eluates from Ni2+-agarose columns. P2X2-His6>P2X6-HA receptors were immunoblotted with a mixture of anti-His6 and anti-HA antibodies.
FIGURE 3
FIGURE 3
AFM imaging of P2X2/6 receptors. (A) AFM image of a sample prepared from mock-transfected cells. (B) AFM image of a typical sample of P2X2-His6>P2X6-HA receptors. Numbers 1, 2, and 3 indicate the assignment of the various particles into one of the three peaks in the frequency distribution of molecular volumes. A shade-height scale is shown at the right. (CE) Frequency distributions of molecular volumes of P2X2-His6>P2X6-HA (C), P2X2-HA>P2X6-His6 (D), and P2X2-His6<P2X6-HA (E) receptors. The curves indicate fitted Gaussian functions.
FIGURE 4
FIGURE 4
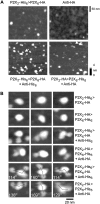
AFM imaging of complexes between P2X2/6 receptors and anti-His6 and anti-HA antibodies. (A) Images of P2X2-His6>P2X6-HA receptors (top left panel), anti-HA antibodies (top right panel), and receptor-antibody complexes (bottom panels). Arrows indicate singly decorated receptors; arrowheads indicate doubly decorated receptors. A shade-height scale is shown at the right. (B) Zoomed images of receptors that are uncomplexed (top two rows) or bound by one (middle two rows) or two (bottom two rows) antibodies.
FIGURE 5
FIGURE 5
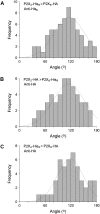
Frequency distributions of angles between antibodies for doubly decorated P2X2/6 receptors. (A) P2X2-His6>P2X6-HA receptors, anti-His6 antibody. (B) P2X2-HA>P2X6-His6 receptors, anti-HA antibody. (C) P2X2-His6<P2X6-HA receptors, anti-His6 antibody. The curves indicate fitted Gaussian functions.

References

    1. Lester, H. A., M. I. Dibas, D. S. Dahan, J. F. Leite, and D. A. Dougherty. 2004. Cys-loop receptors: new twists and turns. Trends Neurosci. 27:329–336. - PubMed
    1. Furukawa, H., S. K. Singh, R. Mancusso, and E. Gouaux. 2005. Subunit arrangement and function in NMDA receptors. Nature. 438:185–192. - PubMed
    1. North, R. A. 2002. Molecular physiology of P2X receptors. Physiol. Rev. 82:1013–1067. - PubMed
    1. Zwart, R., and H. P. M. Vijverberg. 1998. Four pharmacologically distinct subtypes of α4β2 nicotinic acetylcholine receptor expressed in Xenopus laevis oocytes. Mol. Pharmacol. 54:1124–1131. - PubMed
    1. Nelson, M. E., A. Kuryatov, C. H. Choi, Y. Zhou, and J. Lindstrom. 2003. Alternate stoichiometries of α4β2 nicotinic acetylcholine receptors. Mol. Pharmacol. 63:332–341. - PubMed

Publication types