. 2007 Jul 15;93(2):597-609.
doi: 10.1529/biophysj.107.104570. Epub 2007 Apr 20.

A comprehensive calorimetric investigation of an entropically driven T cell receptor-peptide/major histocompatibility complex interaction

Affiliations

A comprehensive calorimetric investigation of an entropically driven T cell receptor-peptide/major histocompatibility complex interaction

Kathryn M Armstrong et al. Biophys J. .

Abstract

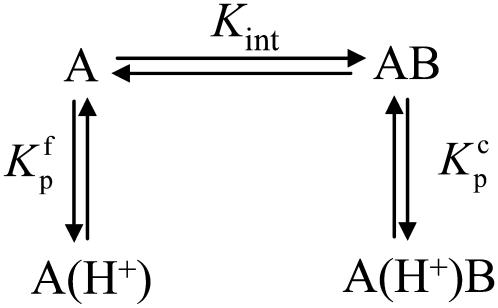
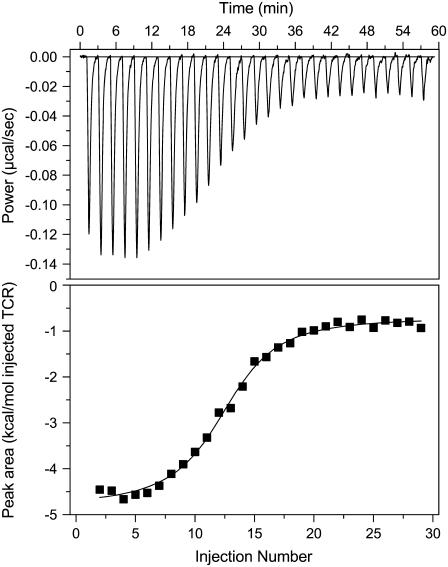
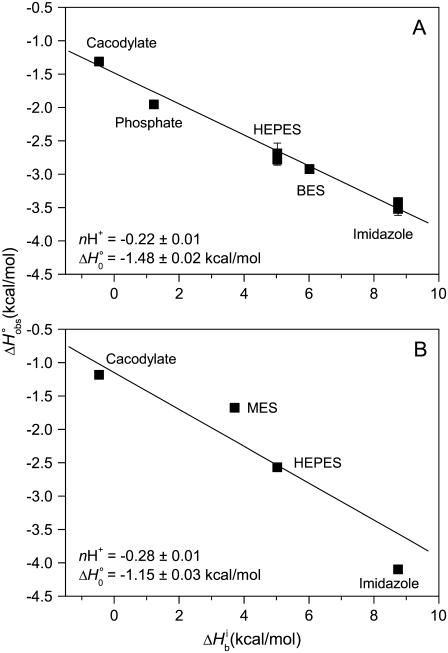
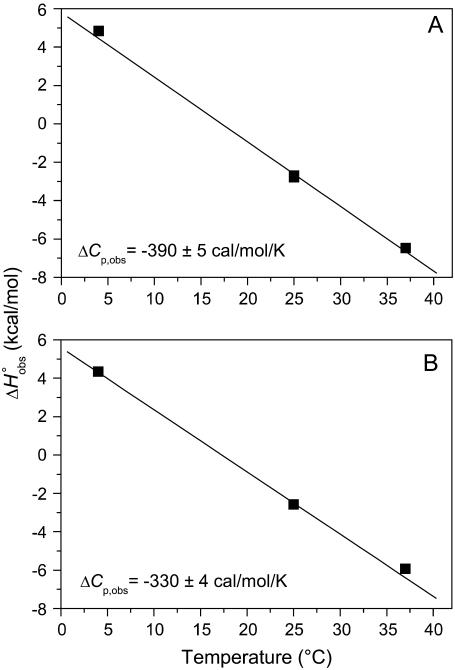
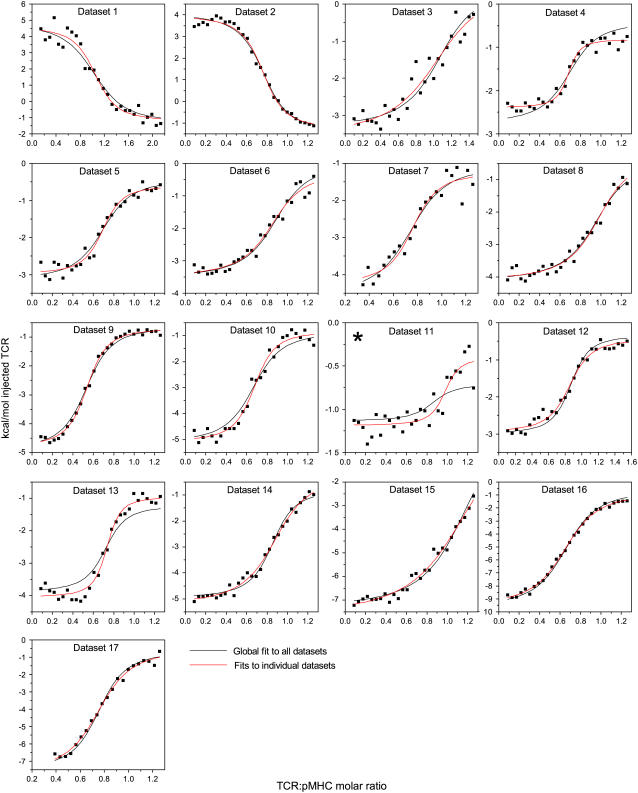
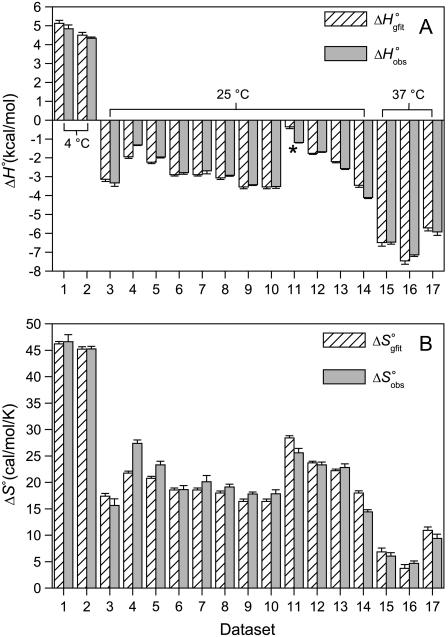
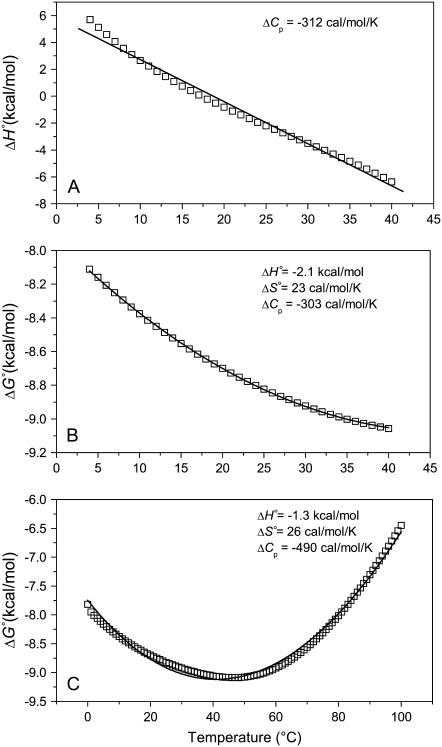
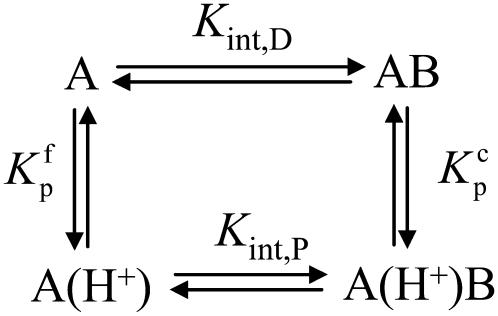
The alphabeta T cell receptor (TCR) is responsible for recognizing peptides bound and "presented" by major histocompatibility complex (MHC) molecules. We recently reported that at 25 degrees C the A6 TCR, which recognizes the Tax peptide presented by the class I MHC human leukocyte antigen-A*0201 (HLA-A2), binds with a weak DeltaH degrees , a favorable DeltaS degrees , and a moderately negative DeltaC(p). These observations were of interest given the unfavorable binding entropies and large heat capacity changes measured for many other TCR-ligand interactions, suggested to result from TCR conformational changes occurring upon binding. Here, we further investigated the A6-Tax/HLA-A2 interaction using titration calorimetry. We found that binding results in a pK(a) shift, complicating interpretation of measured binding thermodynamics. To better characterize the interaction, we measured binding as a function of pH, temperature, and buffer ionization enthalpy. A global analysis of the resulting data allowed determination of both the intrinsic binding thermodynamics separated from the influence of protonation as well as the thermodynamics associated with the pK(a) shift. Our results indicate that intrinsically, A6 binds Tax/HLA-A2 with a very weak DeltaH degrees , an even more favorable DeltaS degrees than previously thought, and a relatively large negative DeltaC(p). Comparison of these energetics with the makeup of the protein-protein interface suggests that conformational adjustments are required for binding, but these are more likely to be structural shifts, rather than disorder-to-order transitions. The thermodynamics of the pK(a) shift suggest protonation may be linked to an additional process such as ion binding.


Figures

SCHEME 1
SCHEME 1
FIGURE 1
FIGURE 1
Isothermal calorimetric titration of 120 μM A6 TCR into 20 μM Tax/HLA-A2 in 20 mM imidazole, pH 6.4, 150 mM NaCl, 25°C. Under these conditions, the fit to a single-site binding model (solid line in lower panel) yielded an enthalpy change of −3.4 kcal/mol, an entropy change of +18 cal/mol per K, and a KD of 0.4 μM.
FIGURE 2
FIGURE 2
A6-Tax/HLA-A2 observed binding enthalpies (formula image) versus buffer ionization enthalpies (formula image) at 25°C in pH 6.4 buffer (A) and pH 7.4 buffer (B). Buffers used are indicated in each panel. The nonzero slopes of the weighted linear fits to the data (solid lines) indicate the presence of proton linkage. The slopes of the lines give the number of protons released by the buffer (nH+) at each pH and are indicated on each plot. The values at formula image= 0 (observed binding enthalpy in a buffer with a zero ionization enthalpy) are also given on each plot.
FIGURE 3
FIGURE 3
A6-Tax/HLA-A2 observed binding enthalpies (formula image) versus temperature in HEPES buffer at pH 6.4 (A) and pH 7.4 (B). The slopes of linear fits to the data (solid lines) yield the observed heat capacity change at each pH, indicated on each plot. pH was constant across the temperature range.
FIGURE 4
FIGURE 4
A6-Tax/HLA-A2 titrations collected as a function of pH, temperature, and buffer ionization enthalpy used in the global analysis. Red lines indicate individual fits to each data set; black lines indicate the results from the simultaneous, global analysis of all 17 data sets. The key to each data set and the results from the individual fits are shown in Table 1. Data set 11 is starred, as the results indicate that the binding enthalpy is extremely weak under the conditions used and that the individual fit is a fit to mostly noise.
FIGURE 5
FIGURE 5
Comparison of the A6-Tax/HLA-A2 binding enthalpies (A) and entropies (B) observed for each titration in Fig. 4 fit individually (formula image and formula image) with the enthalpies and entropies calculated from the global fitted parameters in Table 2 (formula image and formula image). Errors for the individual values are confidence intervals from each individual fit shown in Fig. 4; errors for the calculated values were determined by Monte Carlo analysis as described in Materials and Methods. Data set 11 is highlighted, as the results indicate that the binding enthalpy is extremely weak under the conditions used, accounting for the discrepancy in Fig. 4.
FIGURE 6
FIGURE 6
Proton linkage in the A6-Tax/HLA-A2 interaction results in deviations from ideal behavior. (A) Calculated binding enthalpy changes as a function of temperature in HEPES buffer at pH 7.4 show how proton linkage results in a temperature-dependent observed heat capacity change. The solid line is a fit to the data and the slope (i.e., the apparent heat capacity change) is indicated. (B) Calculated binding free energy changes over the experimentally accessible temperature range of 4–40°C in HEPES at pH 7.4. The solid line represents a nonlinear fit to the modified Gibbs-Helmholtz equation; results are indicated in the inset. Despite an excellent fit, the resulting parameters differ considerably from the intrinsic binding energetics used to generate the data. (C) The simulations in panel B extended to 0–100°C, revealing a much poorer fit to the temperature dependence of ΔG° when an expanded temperature range is used. For all panels, calculated data points were generated using the parameters in Table 2 and Eqs. 1–7. pH was set as 7.4 at the reference temperature of 25°C and allowed to vary with temperature.
SCHEME 2
SCHEME 2

References

    1. Rudolph, M. G., R. L. Stanfield, and I. A. Wilson. 2006. How TCRs bind MHCs, peptides, and coreceptors. Annu. Rev. Immunol. 24:419–466. - PubMed
    1. Davis, M. M., J. J. Boniface, Z. Reich, D. Lyons, J. Hampl, B. Arden, and Y. Chien. 1998. Ligand recognition by αβ T cell receptors. Annu. Rev. Immunol. 16:523–544. - PubMed
    1. Boniface, J. J., Z. Reich, D. S. Lyons, and M. M. Davis. 1999. Thermodynamics of T cell receptor binding to peptide-MHC: evidence for a general mechanism of molecular scanning. Proc. Natl. Acad. Sci. USA. 96:11446–11451. - PMC - PubMed
    1. Willcox, B. E., G. F. Gao, J. R. Wyer, J. E. Ladbury, J. I. Bell, B. K. Jakobsen, and P. A. van der Merwe. 1999. TCR binding to peptide-MHC stabilizes a flexible recognition interface. Immunity. 10:357–365. - PubMed
    1. Anikeeva, N., T. Lebedeva, M. Krogsgaard, S. Y. Tetin, E. Martinez-Hackert, S. A. Kalams, M. M. Davis, and Y. Sykulev. 2003. Distinct molecular mechanisms account for the specificity of two different T-cell receptors. Biochemistry. 42:4709–4716. - PubMed

Publication types

MeSH terms