

Review
doi: 10.1002/nbm.1146.
MRI in mouse developmental biology
Affiliations
- PMID: 17451170
- PMCID: PMC2694493
- DOI: 10.1002/nbm.1146
Item in Clipboard
Review
MRI in mouse developmental biology
NMR Biomed.
2007 May.
Abstract
Mice are used in many studies to determine the role of genetic and molecular factors in mammalian development and human congenital diseases. MRI has emerged as a major method for analyzing mutant and transgenic phenotypes in developing mice, at both embryonic and neonatal stages. Progress in this area is reviewed, with emphasis on the use of MRI to analyze cardiovascular and neural development in mice. Comparisons are made with other imaging technologies, including optical and ultrasound imaging, discussing the potential strengths and weaknesses of MRI and identifying the future challenges for MRI in mouse developmental biology.
Copyright (c) 2007 John Wiley & Sons, Ltd.
Figures
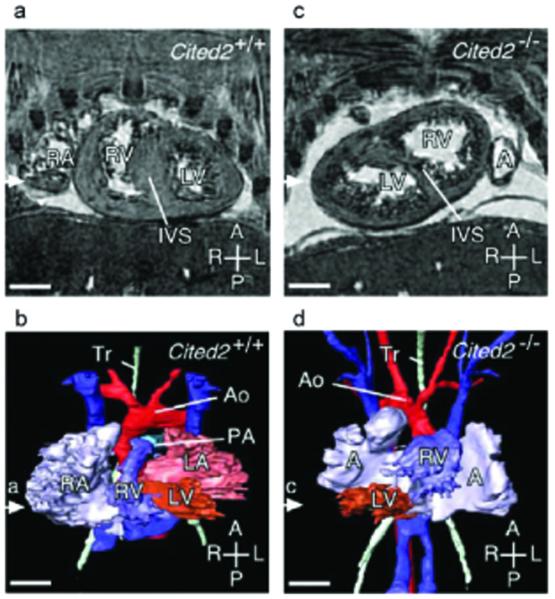
Cardiovascular laterality defects in Cited2 mutant embryos at embryonic day 15.5 (MRI of cardiac anatomy). Coronal sections and 3D reconstructions (ventral views) are shown of wild-type (Cited2+/+) and mutant (Cited2-/-) embryonic hearts. (a, b) Wild-type heart where the right ventricle (RV) is dextral to the left and gives rise to the main pulmonary artery (PA). The left ventricle (LV) gives rise to the aorta (Ao). Also indicated is the trachea (Tr) and interventricular septum (IVS). (c, d) Cited2 mutant heart with sinistral looping: the right ventricle is sinistral (and anterior) to the left ventricle. Scale bars, 500 μm. Axes: R, right; L, left; A, anterior; P, posterior. RA, Right atrium; LA, left atrium. Reprinted, with permission, from ref. (7).
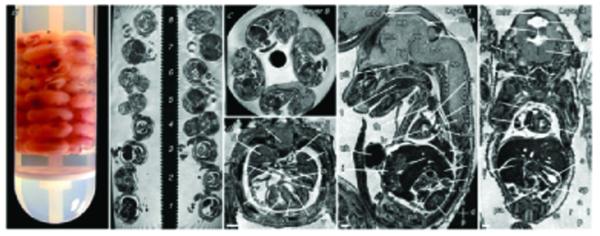
High-throughput high-resolution MR microscopy. (a) Stack of 32 embryos embedded in a NMR tube. (b) Section through the long axis of the NMR tube showing embryos in eight layers. (c) Sagittal section through layer 8 showing the four embryos in this layer. (d-f) Transverse, sagittal, and coronal sections through individual embryos in layers 5, 1 and 4 respectively. The voxel size is 25.4 × 25.4 × 24.4 μm. Structures indicated are the spinal cord (sc), the right and left lungs, atria and ventricles (rl, ll, ra, la, rv, lv), primary atrial and interventricular septa (pas, ivs), mitral valve (mv), midbrain roof (mbr), midbrain (mb), mesencephalic vesicle (mes), thalamus (tha), hypothalamus (hy), pons (po), cerebellum (c), medulla oblongata (mo), pituitary (pit), tongue (t), thymus (th), left superior vena cava and main bronchus (lsvc, lmb), aorta (ao), liver (li), stomach (s), left adrenal and kidney (lad, lk), pancreas (pa), intestines (i), umbilical hernia (uh), aqueduct of Sylvius (aq), fourth ventricle (fv), inner ear (ie), larynx (lar), right ventricular outflow tract (rvot), spleen (sp), and testes (te). Scale bars = 500 μm; axes: d, dorsal; v, ventral; r, right; l, left; a, anterior; p, posterior. Reprinted, with permission, from ref. (9).
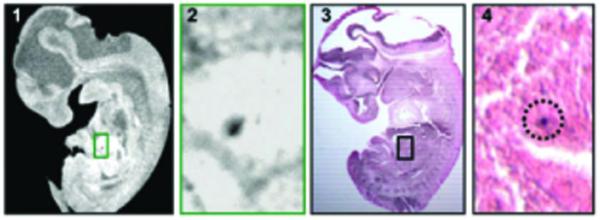
MRI and histology of micron-sized iron oxide (Bangs) particles in an embryonic day (E)11.5 mouse embryo. (1) Slice from 3D MRI dataset. (2) Expansions of the boxed region in (1), showing susceptibility-induced contrast regions in each image. (3) Matching histological section that corresponds to the same plane as the accompanying MRI. (4) A second image of the section in (3), acquired with a higher magnification, approximately representing the boxed region. The iron stain from the individual particle is circled to assist visualization in the histology. Shown are single 1.63 μm particles registered to the areas of dark contrast in the MRI. Each embryo image is 6.75 mm from head to tail, in both the MRI and the histology. Insets are ×10 magnification. Reprinted, with permission, from ref. (15).
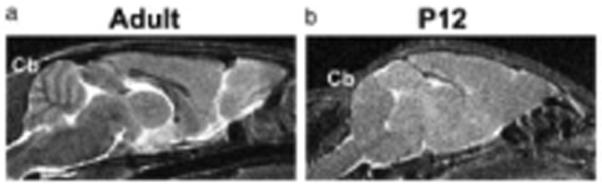
Short time inversion recovery (STIR) images, providing additive T1 and T2 contrast, can be used to visualize adult, but not neonatal, cerebellar folia. Mid-sagittal STIR images of adult (a) and postnatal day (P)12 (b) mouse brains. The foliation pattern in the cerebellum (Cb) can be visualized in the adult (500 μm slice thickness) through the presence of myelin (dark), but not in the neonatal mouse (300 μm slice thickness). Reprinted, with permission, ref. (22).
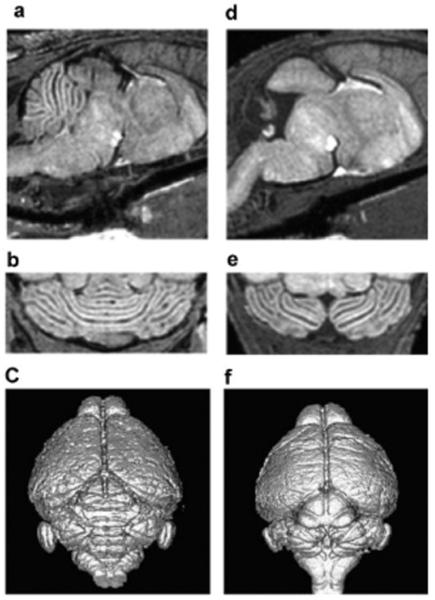
Use of MEMRI for phenotyping neonatal cerebellar defects. Sagittal (a, d) and horizontal (b, e) T1-weighted images, and surface-rendered volumetric images (c, f) of a wild-type P11 mouse cerebellum (a-c), compared with a Gbx2 mutant littermate (d-f) showing the extensive deletion of most of the central cerebellum in the Gbx2 mutant. Reprinted, with permission, from ref. (22).
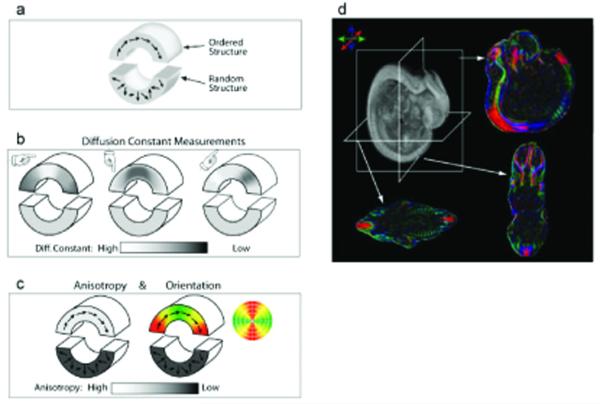
Principles of DTI. (a) A schematic diagram representing brain structures, where the upper region has an ordered structure resulting from fibers running along the curved arrow, whereas the lower region has a random fiber structure. (b) Diffusion measurements along three different axes are indicated by the directions of the fingers. The apparent diffusion constant becomes faster if the fiber orientation coincides with the measurement orientation, and slower when they are perpendicular to each other. This results in different diffusion constants that depend on the measurement orientation in the upper region, whereas the lower region is insensitive to the measurement orientation. (c) Results of DTI. Anisotropy (diffusion directionality) of the upper region is high because the diffusion constant of this region depends on measurement orientation. When anisotropy is high, the fiber angle can be calculated from the information in (b), which can be represented by vectors or by color. In this two-dimensional example, regions with fibers running horizontally are green and those running vertically are red. Transition areas become yellow, representing a mixture of green and red. (d) Actual DTI-based images of a mouse embryo. The raw data are 3D, and arbitrary slice angles and positions can be extracted. The anisotropy and orientation maps have the same image intensity, but the orientation maps have extra orientation information represented by colors. In the color map, fibers orienting along right-left, dorsal-ventral, caudal-rostral axes are indicated by green, blue, and red, respectively. Reprinted, with permission, from ref. (26).
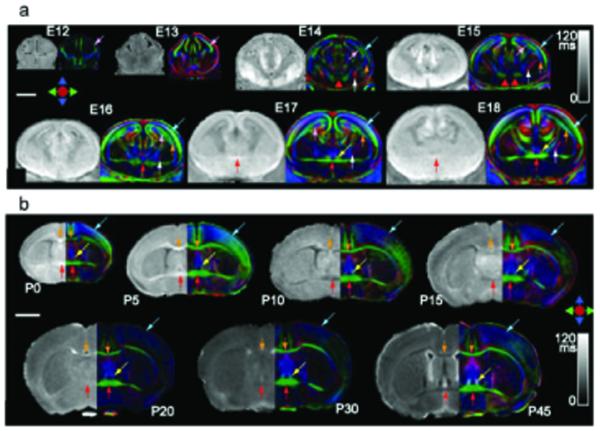
DTI of developing mouse brains. (a) T2 and DTI color map images of embryonic mouse brains, from embryonic day (E) 12 to 18. (b) T2 and DTI maps of postnatal mouse brains, from postnatal day (P) 0 to 45. 3D images were carefully aligned to ensure proper orientation and position, and two-dimensional coronal images were selected at the level of the anterior commissure. T2 map images were scaled from 0 to 120 ms. Colored arrows indicate the location of the cortical plate (blue), the intermediate zone (orange) and the ventricular zone or neuroepithelium (pink) in embryonic brain (a). White matter tracts shown here include the anterior commissure (red arrows), the corpus callosum (orange arrows), the fornix (yellow arrows), and the internal capsule (white arrows) in postnatal brains (b). Scale bars are 2 mm. Reprinted, with permission, from ref. (28).
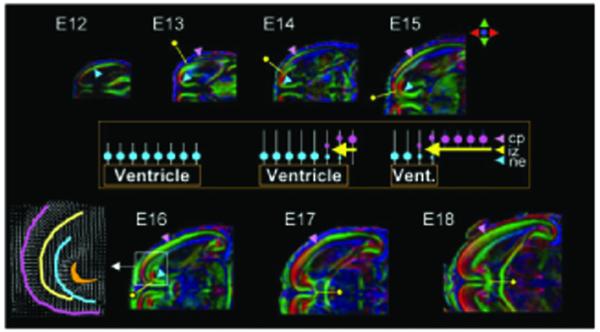
Cortical and white matter development. Horizontal planes of the color maps from embryonic day (E)12 to 18 brains. Blue and pink arrowheads indicate locations of the neuroepithelium (ne) and cortical plate (cp). Yellow pins indicate the leading edge of the growing intermediate zone (iz) or axonal tracts in between the ne and cp. The inset diagram explains the cellular events during E12-E18 based on radial migration theory. Blue circles indicate neurons in the ne from newborn mice, white bars represent migration scaffolds by the radial glia, pink circles are neurons in the cp, and yellow arrows are the growing axons. At E12, there is only one layer (ne), which has radial structures around the ventricle. At E13, the cp emerges and simultaneously afferent and efferent axons (iz) arrive between the ne and cp layers, resulting in a transient three-layer structure. Between E14 and E18, the cp progresses to completion, with concomitant loss of the ne layer and ventricle shrinkage, while the axons follow the leading edge of the cp. A portion of the E16 brain (white box) is enlarged to show the fiber orientation in a vectorial format. Images in each panel are scaled independently. See ref. (26) for details on the spatial resolution of each image. Reprinted, with permission, from ref. (26).
References
-
- Smith BR, Linney E, Huff DS, Johnson GA. Magnetic resonance microscopy of embryos. Comput Med Imaging Graph. 1996;20:483–490. - PubMed
-
- Smith BR. Magnetic resonance microscopy in cardiac development [Review] Microsc Res Tech. 2001;52:323–330. - PubMed
-
- Huang GY, Wessels A, Smith BR, Linask KK, Ewart JL, Lo CW. Alteration in connexin 43 gap junction gene dosage impairs conotruncal heart development. Dev Biol. 1998;198:32–44. - PubMed
-
- Dhenain M, Ruffins SW, Jacobs RE. Three-dimensional digital mouse atlas using high-resolution MRI. Dev Biol. 2001;232:458–470. - PubMed
Publication types
MeSH terms
Substances
Grants and funding
LinkOut - more resources
Full Text Sources
Medical
