. 2007 Apr 23:4:28.
doi: 10.1186/1742-4690-4-28.

hnRNP E1 and E2 have distinct roles in modulating HIV-1 gene expression

Affiliations

hnRNP E1 and E2 have distinct roles in modulating HIV-1 gene expression

Kathryn Woolaway et al. Retrovirology. .

Abstract

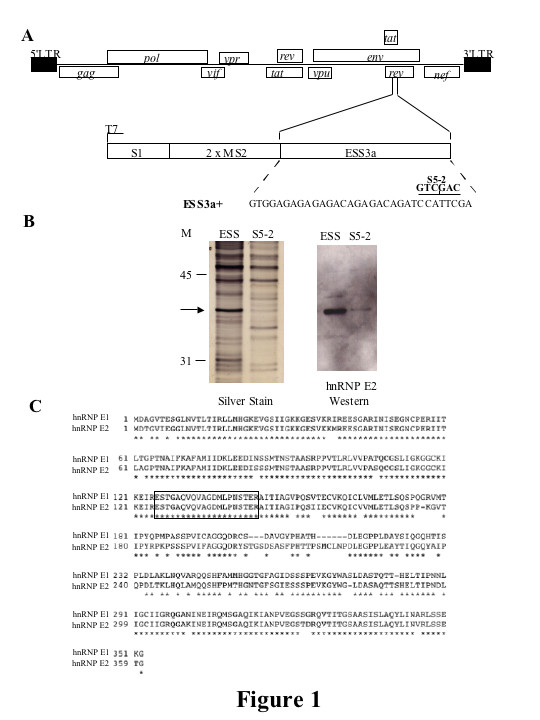
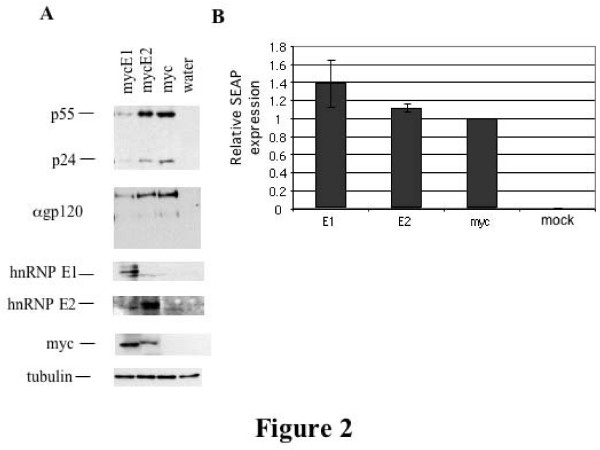
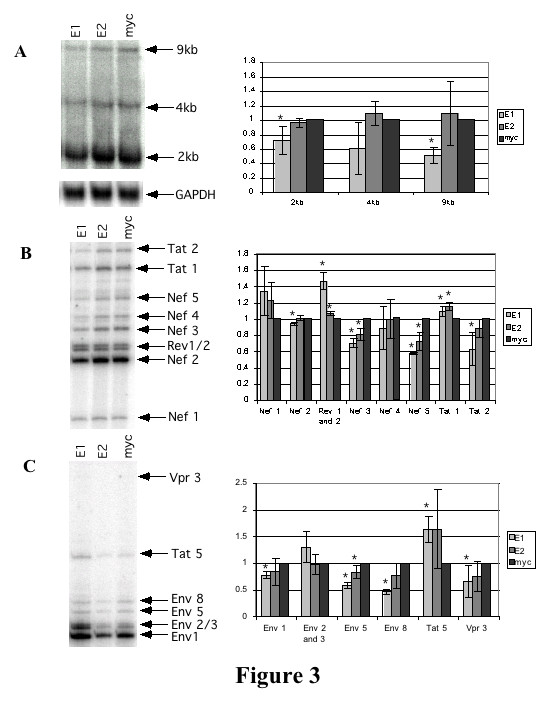
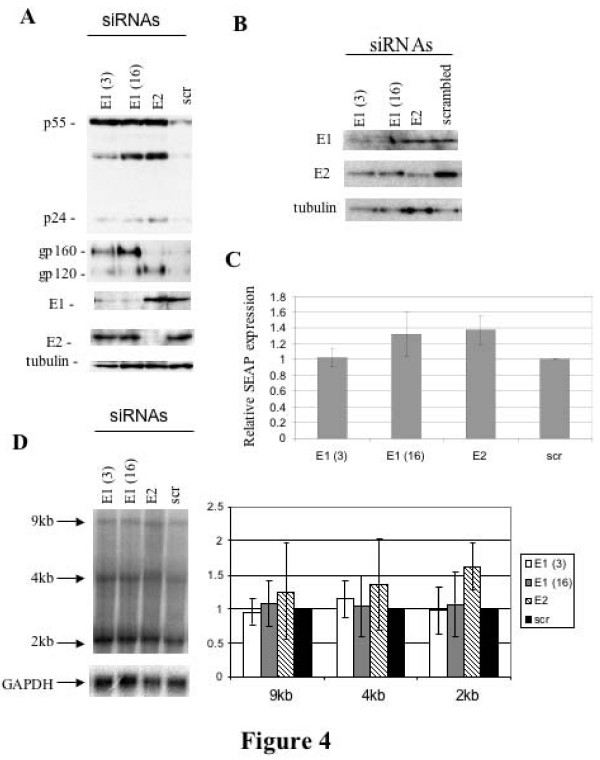
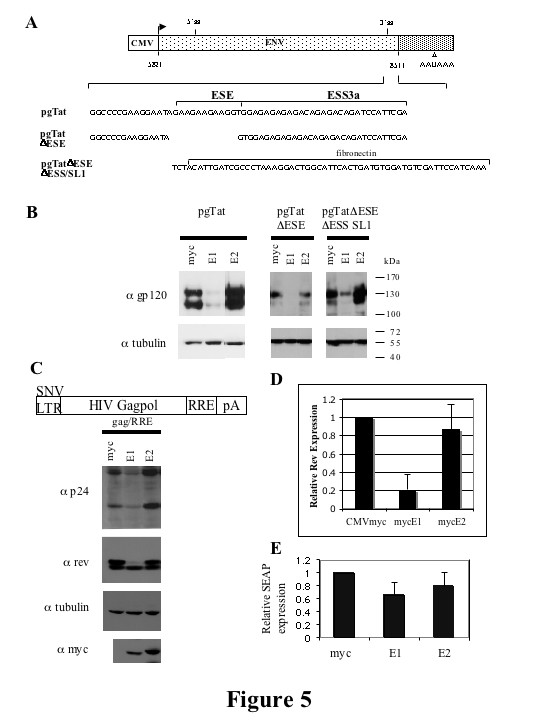
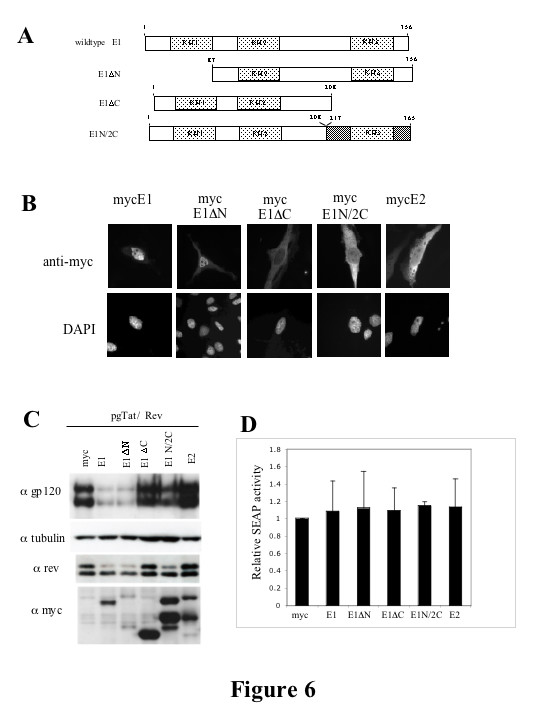
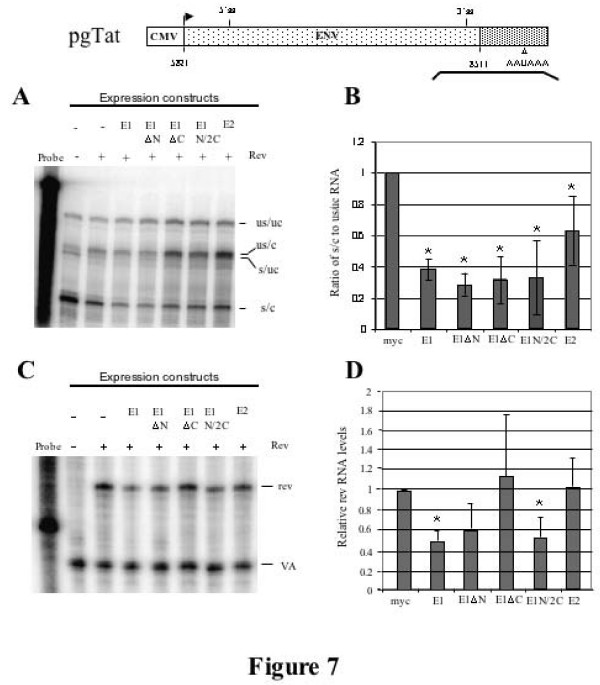
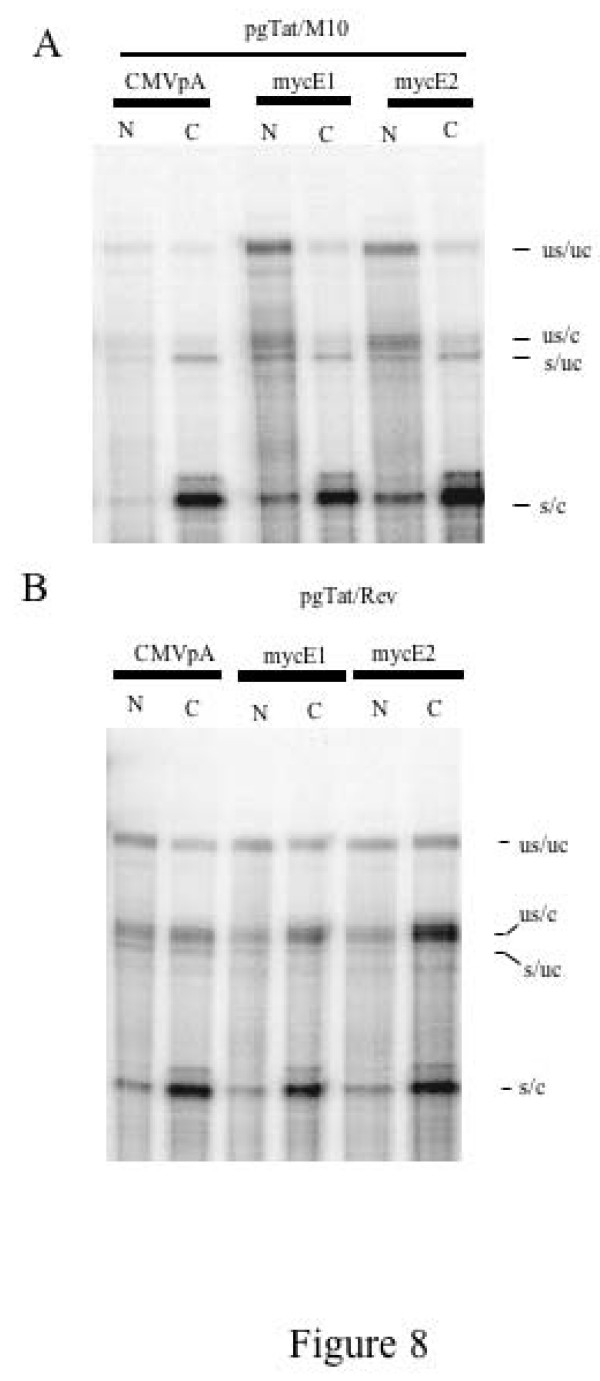
Pre-mRNA processing, including 5' end capping, splicing, and 3' end cleavage/polyadenylation, are events coordinated by transcription that can influence the subsequent export and translation of mRNAs. Coordination of RNA processing is crucial in retroviruses such as HIV-1, where inefficient splicing and the export of intron-containing RNAs are required for expression of the full complement of viral proteins. RNA processing can be affected by both viral and cellular proteins, and in this study we demonstrate that a member of the hnRNP E family of proteins can modulate HIV-1 RNA metabolism and expression. We show that hnRNP E1/E2 are able to interact with the ESS3a element of the bipartite ESS in tat/rev exon 3 of HIV-1 and that modulation of hnRNP E1 expression alters HIV-1 structural protein synthesis. Overexpression of hnRNP E1 leads to a reduction in Rev, achieved in part through a decrease in rev mRNA levels. However, the reduction in Rev levels cannot fully account for the effect of hnRNP E1, suggesting that hmRNP E1 might also act to suppress viral RNA translation. Deletion mutagenesis determined that the C-terminal end of hnRNP E1 was required for the reduction in Rev expression and that replacing this portion of hnRNP E1 with that of hnRNP E2, despite the high degree of conservation, could not rescue the loss of function.


Figures

Figure 1
Figure 1
Identification of trans-acting factors that associate with ESS3a. RNA affinity columns were programmed withTRAP-tagged RNA transcripts of ESS3a or with a mutant of ESS3adesignated ESS3a 5-2. HeLa nuclear extract was passed over the columns and column eluates fractionated by SDS-PAGE and silver stained. ESS3a enriched bands were excised and sequenced by mass spectrometry. (A) Schematic representation of HIV-1 genome. Open boxes represent the open reading frames encoding the indicated viral proteins, shaded boxes indicate 5' and 3' LTRs. Also shown is a schematic of the TRAP-ESS vector. The construct contains a Streptavidin binding aptamer, S1 and two MS2 coat protein binding sites followed by the ESS3a sequence. The sequence of ESS3a is shown. The altered nucleotides of the mutant designated ESS3a 5-2 are indicated above the wild-type sequence. (B) Silver stain of proteins eluted from Streptavidin column with indicated RNA bait. Proteins were fractionated on 10% SDS-PAGE. The arrow indicates the excised band. Western blot against hnRNP E2; ESS or mutant thereof are as shown (C) Comparison of hnRNP E1 and hnRNP E2. Boxed is the sequence generated from the excised band analyzed by mass spectrometry.
Figure 2
Figure 2
hnRNP E1 but not E2 overexpression decreases HIV-1 structural protein levels. 293 cells were transfected with mycE1, mycE2 or the empty CMVmyc vector, alongside provirus HxBruR-/RI- andCMVPLAP. 48 hrs post transfection, cells were lifted in 1×PBS and a fraction (1/4) of the cells lysed in 9 M urea, 5 mM Tris pH8 and fractionated on SDS-PAGE gels. Protein was transferred to PVDF membrane and probed with antibody to p24. Blots were stripped in 62.5 mM TrisHCl pH 6.7, 2%SDS, 100 mM β-mercaptoethanol and reprobed with antibodies to gp160/120 (α gp120), hnRNP E1 and E2, myc and tubulin as indicated. (A) Results of western blotting. Antibodies and transfected plasmids are as indicated. (B) Relative SEAP expression in transfected cells. Levels were normalized to that of the empty CMVmyc vector control. Results shown are an average of three experiments. Error bars represent standard deviation.
Figure 3
Figure 3
hnRNP E1 and E2 overexpression have only limited effects on HIV-1 RNA levels. 293 cells were transfected with eithermycE1 (E1), mycE2 (E2) or CMVmyc (myc) along with provirus HxBruR-/RI- and CMV PLAP. 48 hrs post transfection, cells were lifted in 1×PBS and total RNA isolated. Northern and RT-PCRs were performed. (A) Northern analysis of the effect of mycE1/E2 overexpression on levels of 2 kb, 4 kb and 9 kb classes of HIV-1 RNA. Probe derived from the HIV-1 LTR was used to detect all 3 classes of viral RNA; viral RNAs (9, 4, 2 kb) are indicated. Blots were stripped and reprobed for GAPDH RNA to confirm equal loading. At right, a summary of 3 sets of experimental results quantitated using Image Quant v5.2. Figures are normalized to GAPDH with the results for the myc control vector set at 1 for each RNA class. Error bars show standard deviation. An asterisk denotes 95% confidence level that the difference between the sample and the myc control is significant. (B) RT-PCR showing effects of mycE1 and mycE2 on the 2 kb species of HIV-1 RNA. Reporter plasmids and identity of amplicons are indicated. At right, a summary of 3 sets of experimental results quantitated using Image Quant v5.2. Shown is the percentage of each species of the total RNA for each lane. For each species of RNA the myc value was set at 1. Error bars show standard deviation. An asterisk denotes 95% confidencelevel that the difference between the sample and the myc control is significant. (C) RT-PCR showing effects of mycE1 and mycE2 on the 4 kb species of HIV-1 RNA. Reporter plasmids and identity of amplicons are indicated. At right, a summary of 3 sets of experimental results, quantitated using Image Quant v5.2 as described in (B).
Figure 4
Figure 4
Depletion of hnRNP E1 and E2 alters HIV-1 gene expression. 293 cells were transfected with siRNAs to hnRNP E1(E1(3) or E1(16)), hnRNP E2 (E2) or a scrambled siRNA control (scr)using Oligofectamine. 24 hrs later, cells were transfected withHxBruR-/RI- provirus and CMVPLAP using Fugene. 48 hrs post transfection, cells were harvested, lysates fractionated on SDS-PAGE gels and analyzed by western blot. (A) Results of western blotting. Proteins examined and siRNAs used are as indicated. (B) Kinetics of siRNA depletion of hnRNP E1/E2. Cells were treated with control siRNA (scrambled) or directed to hnRNP E1 (E1(3), E1(16)), or hnRNP E2 (E2) and harvested 24 h after transfection. Cell extracts were fractionated on SDS PAGE gels, transferred to PVDF membrane and probed with antibody to hnRNP E1 (E1), hnRNP E2 (E2), or tubulin (tubulin). (C) Relative SEAP expression in transfected cells. Media was harvested 48 hrs post transfection and assayed for SEAP activity. Levels were normalized to that of the scrambled siRNA control. Results shown are an average of three experiments. Error bars represent standard deviation. (D) Northern analysis of the effect of hnRNP E1/E2 depletion on HIV RNA levels. Cells were treated with siRNAs as above and total RNA extracted. Following fractionation on formaldehyde agarose gels and transfer to nitrocellulose membrane, blots were probed to detect viral RNAs (9, 4, and 2 kb). Blots were reprobed for GAPDH RNA to confirm equal loading. Quantitation of 3 experiments is shown at right. Results were normalized to GAPDH with the data for the scrambled siRNA sample (scr) set at 1. Error bars show standard deviation.
Figure 5
Figure 5
hnRNP E1 but not hnRNP E2 inhibit expression of subgenomic HIV-1 expression vectors. (A) Schematic of HIV-1 env expression vector, pgTat, including the location of the ESE and ESS. The sequences of pgTat derivatives pgTatΔESE and pgTatΔESEΔESS SL1 are shown. (B) HeLa cells were co-transfected with pgTat or derivatives thereof, SVH6Rev, and hnRNP E expressing plasmids as indicated. 48 hours post-transfection, cells were harvested in RIPA buffer, and lysates fractionated on SDS-PAGE gels. Following transfer to PVDF membranes, blots were probed with antibody against gp120 and tubulin. (C) Effect of hnRNP E proteins on Gag/RRE expression. Shown is a diagram of the Gag expression construct used. HeLa cells were transfected with Gag/RRE, hnRNP E and Rev expression constructs as indicated. 48 hrs post transfection, cells were harvested, and lysates fractionated on SDS-PAGE gels. Blots were probed with antibody against Rev and p24, stripped then reprobed for tubulin and myc to confirm equal loading and similar expression of myc-tagged constructs respectively. To quantitate changes in Rev protein expression, blots were scanned and analyzed in Imagequant. Summary of 5 independent determinations is shown (D). (E) Effect of hnRNP E proteins on SEAP expression. Media from cells transfected with a SEAP expressing plasmid was harvested 48 hrs post transfection and SEAP expression normalized to that seen upon cotransfection with the CMVmyc control vector. Results shown are an average of 3 experiments. Error bars show standard deviation. SEAP expression of the myc control vector was set to 1.
Figure 6
Figure 6
Suppression of HIV-1 gene expression by hnRNP E1 is dependent upon the C-terminal KH domain. (A) Schematic of hnRNP E1 and domain mutants thereof. Light grey boxes denote the KH domains. Dark shading denotes hnRNP E2 sequence and white indicates hnRNP E1 sequence. (B) Localization of hnRNP E1 and domain mutants and hnRNP E2. HeLa cells were grown on coverslips and transfected with the hnRNP E expressing plasmids. 48 hrs post transfection, cells were washed with 1× PBS, fixed in 4% paraformaldehyde, 1× PBS and localization of transfected hnRNP E proteins (anti-myc) and nuclei (DAPI) determined. Magnification is 630×. Shown are representative examples of results obtained in multiple trials. (C) 293T cells were transfected with mycE1/E2 expressing plasmids as indicated along with pgTat and SVH6Rev. 48hrs post transfection, cells were harvested and lysates fractionated on SDS-PAGE gels. Following transfer to PVDF membranes, blots were probed with antibody to gp120, tubulin, rev or the myc tag. Cell supernatants were analyzed for levels of SEAP expression (D).
Figure 7
Figure 7
hnRNP E1 overrexpression selectively affects spliced HIV-1 env RNA levels. (A) Shown is a diagram of the pgTat vector with the line below indicating the position of the probe (spanning both the 3'ss and polyadenylation sequence) used for RPA analysis. 293T cells were transfected with hnRNP E expressing plasmids as indicated, alongside pgTat and SVH6Rev. RNA was isolated 48 hours post transfection and used in RNase protection assays. Protection products were resolved on denaturing PAGE gels. Analysis of 3' end processing of unspliced env RNA by RNase protection assay. Identities of the various bands observed are indicated; unspliced, uncleaved (US/UC); unspliced, cleaved (US/C); spliced, uncleaved(S/UC); spliced, cleaved (S/C). (B) Graphical representation of the effect of hnRNP E proteins on the ratio of s/c to us/uc RNA. Averages of a minimum of three independent experiments are shown. Asterisk denotes values that were deemed significantly different from control at p < 0.05 (C) 293T cells were transfected with hnRNP E expressing plasmids as indicated, alongside Gag/RRE and SVH6Rev. 48 hrs post transfection RNA was isolated and used in RNase protection assays. Analysis of rev RNA levels by RNase protection assay. rev RNA abundance was corrected using the cotransfected VA control (pSPVA) and normalized to the vector control indicated by (-). (D) Summary of the effect of N- and C-terminal KH domain mutants of hnRNP E on rev RNA levels. Averages of a minimum of three independent experiments are shown. Asterisk denotes values that were deemed significantly different from control at p < 0.05
Figure 8
Figure 8
Effect of hnRNP E1/E2 Overexpression on the Subcellular Distribution of Viral RNAs. 293T cells were transfected with control (CMVpA) or mycE1/E2 expression plasmids as indicated, alongside pgTat and either an inactive form of Rev (M10) (A) or wild type Rev (B). Following harvest, nuclear and cytoplasmic fractions were prepared, RNA extracted and used in RNase protection assays. Protection products were resolved on denaturing PAGE gels. Identities of the various bands observed are indicated; unspliced, uncleaved (US/UC); unspliced, cleaved (US/C); spliced, uncleaved (S/UC); spliced, cleaved (S/C).

Similar articles

Cited by

References

    1. Bentley D. The mRNA assembly line: transcription and processing machines in the same factory. Current Opinion in Cell Biology. 2002;14:336–342. doi: 10.1016/S0955-0674(02)00333-2. - DOI - PubMed
    1. Dirks RW, Hattinger CM, Molenaar C, Snaar SP. Synthesis, processing, and transport of RNA within the three-dimensional context of the cell nucleus. Critical Reviews in Eukaryotic Gene Expression. 1999;9:191–201. - PubMed
    1. Jimenez-Garcia LF, Spector DL. In Vivo Evidence That Transcription and Splicing Are Coordinated by a Recruiting Mechanism. . Cell. 1993;73:47–59. doi: 10.1016/0092-8674(93)90159-N. - DOI - PubMed
    1. Neugebauer KM. On the importance of being co-transcriptional. Journal of Cell Science. 2002;115:3865–3871. doi: 10.1242/jcs.00073. - DOI - PubMed
    1. Proudfoot NJ, Furger A, Dye MJ. Integrating mRNA processing with transcription. Cell. 2002;108:501–512. doi: 10.1016/S0092-8674(02)00617-7. - DOI - PubMed

Publication types

MeSH terms

Substances