. 2007 Apr 23:8:135.
doi: 10.1186/1471-2105-8-135.

Supervised multivariate analysis of sequence groups to identify specificity determining residues

Affiliations

Supervised multivariate analysis of sequence groups to identify specificity determining residues

Iain M Wallace et al. BMC Bioinformatics. .

Abstract

Background: Proteins that evolve from a common ancestor can change functionality over time, and it is important to be able identify residues that cause this change. In this paper we show how a supervised multivariate statistical method, Between Group Analysis (BGA), can be used to identify these residues from families of proteins with different substrate specifities using multiple sequence alignments.

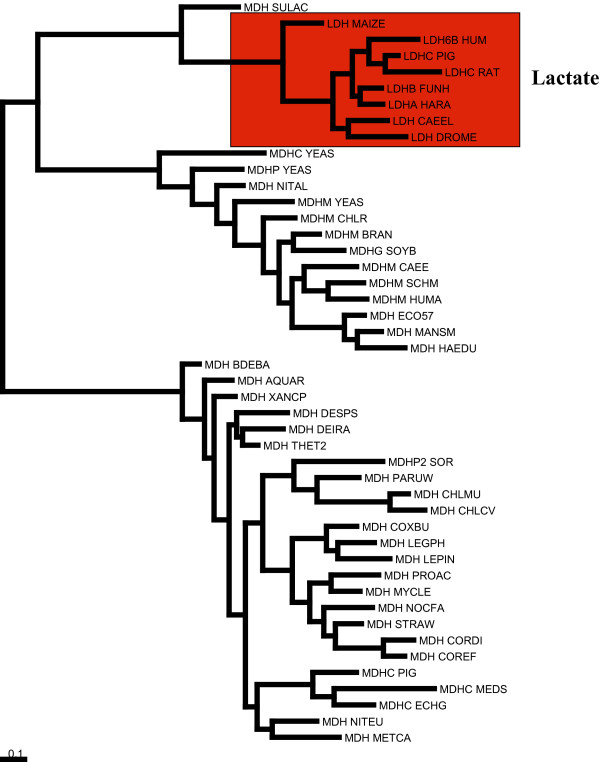
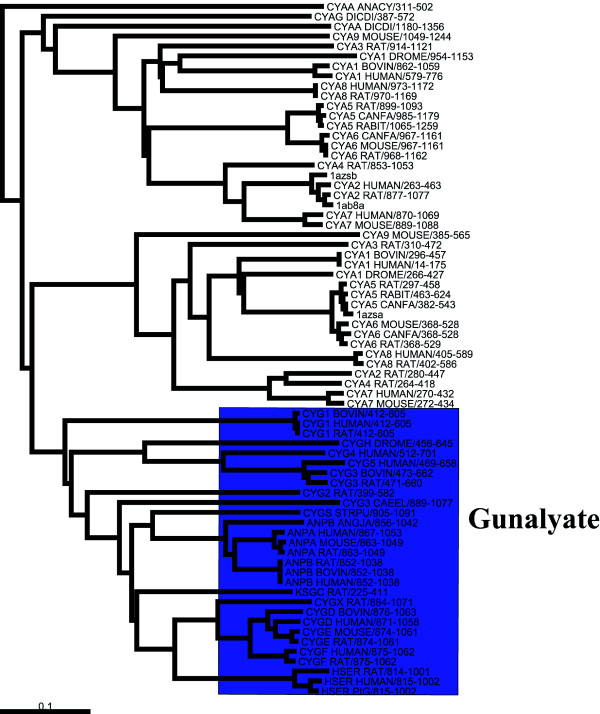
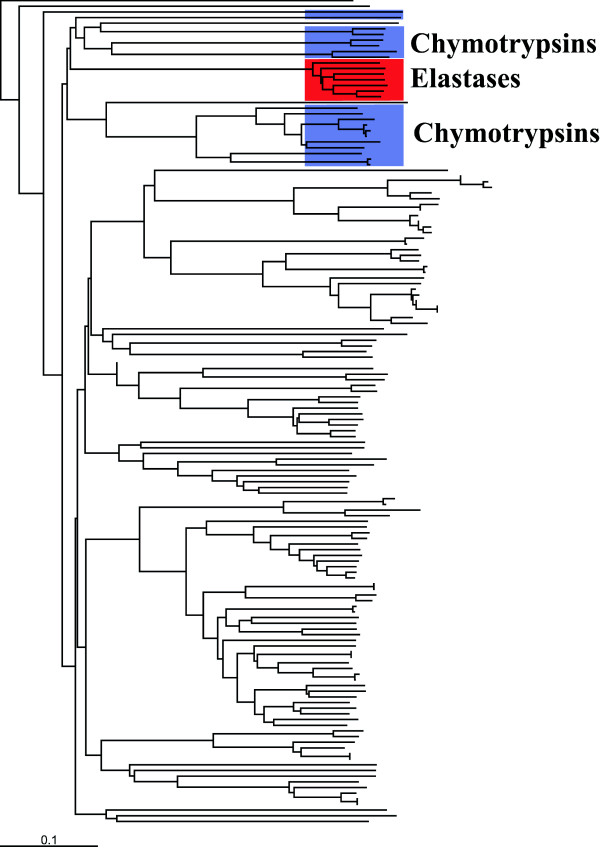
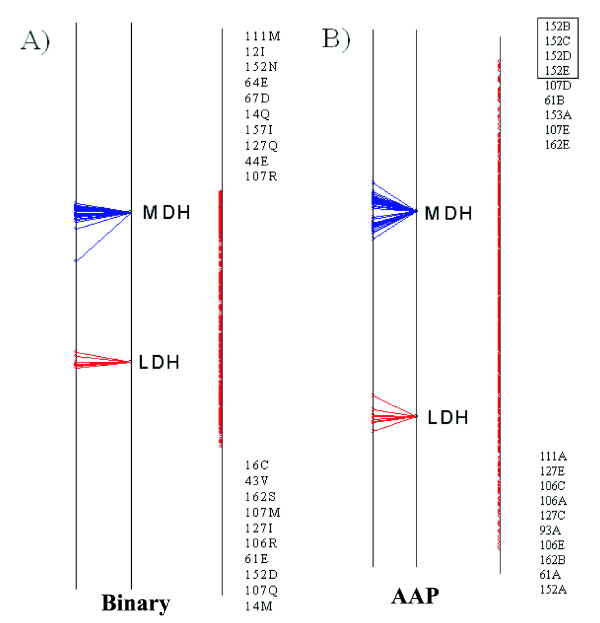
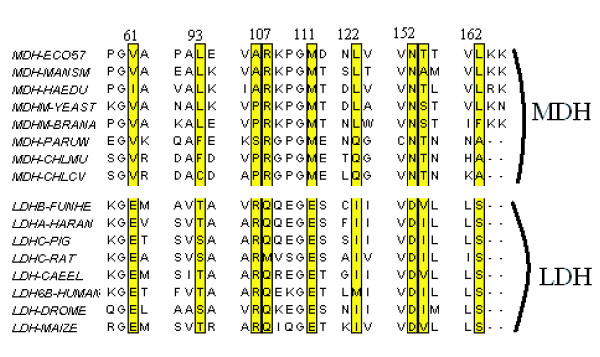
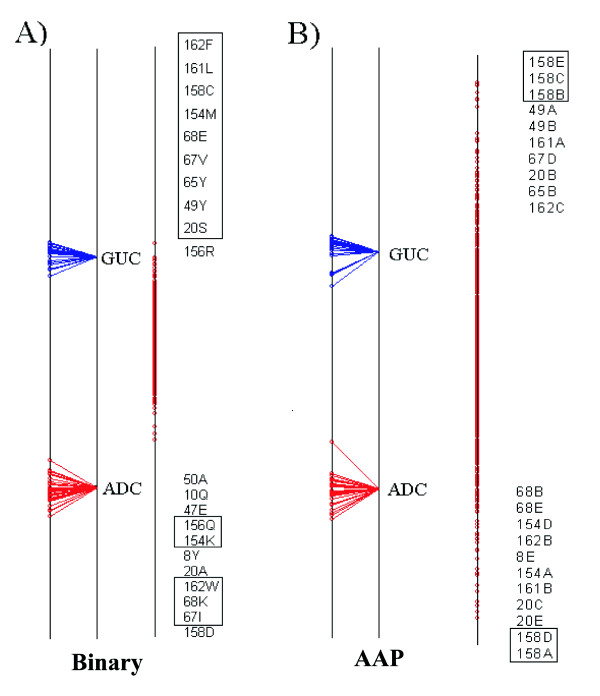
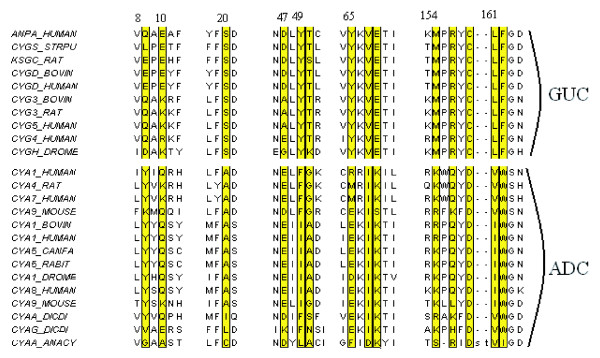
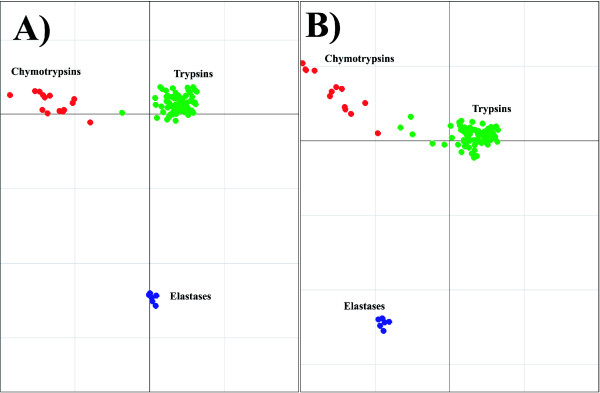
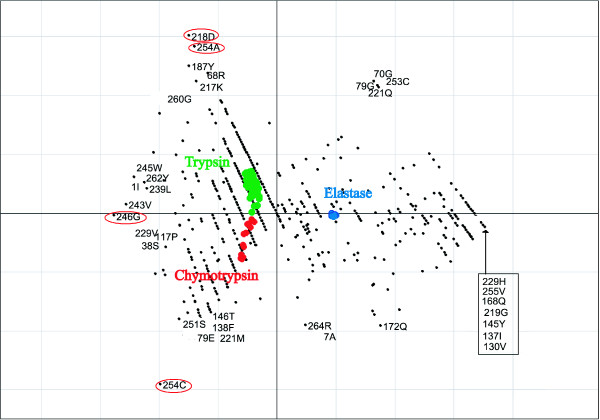
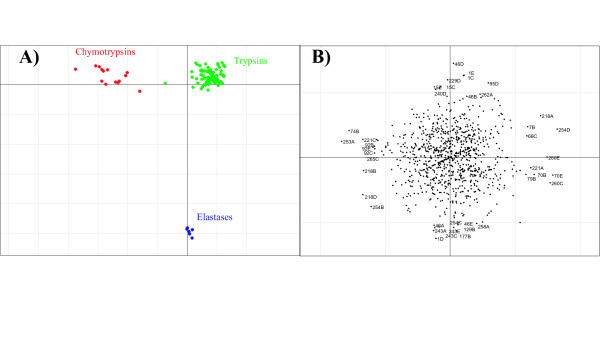
Results: We demonstrate the usefulness of this method on three different test cases. Two of these test cases, the Lactate/Malate dehydrogenase family and Nucleotidyl Cyclases, consist of two functional groups. The other family, Serine Proteases consists of three groups. BGA was used to analyse and visualise these three families using two different encoding schemes for the amino acids.

Conclusion: This overall combination of methods in this paper is powerful and flexible while being computationally very fast and simple. BGA is especially useful because it can be used to analyse any number of functional classes. In the examples we used in this paper, we have only used 2 or 3 classes for demonstration purposes but any number can be used and visualised.


Figures

Figure 1
Figure 1
Phylogenetic tree of lactate/malate dehydrogenases sequences. The Lactate sequences are coloured in red.
Figure 2
Figure 2
Phylogenetic tree of the nucleotidyl cyclases sequences. The guanylate sequences are coloured in blue.
Figure 3
Figure 3
Phylogenetic tree of serine protease sequences. The elastases are highligthed in red and the chymotrypsins are in blue.
Figure 4
Figure 4
Axis 1 of the Between Group Analysis for the Lactate/Malate Dehydrogenase test case using the binary encoding (A) and the AAP encoding (B). In each example the sequence split is shown on the left, the residues are plotted on the right. The top 10 residues at either end of the axis are shown. Any residues that are plotted at the same coordinate are enclosed in a text box. Each variable consists of a number, which is the alignment position, followed by a residue type or factor, depending on which encoding system was used.
Figure 5
Figure 5
Alignment of a sample of the lactate/malate dehydrogenase sequences with positions highlighted that the analysis using the AAP residues identified as being important for specifity. The alignment was drawn with JalView [42].
Figure 6
Figure 6
Axis 1 of the Between Group Analysis for the Nucleotidyl cyclases test case. Details as Figure 4
Figure 7
Figure 7
Alignment of a sample of Nucleotidyl cyclases sequences with positions highlighted that the analysis using the binary variables identified as being important for specifity. The alignment was drawn with JalView [42].
Figure 8
Figure 8
Demonstration of the effect of sequence weighting using the AAP encoding. The example using sequences weights is A). The unweighted example is B). The chymotrypsin sequences are plotted in red, trypsin sequences in green and the elastase are plotted in blue.
Figure 9
Figure 9
Axis 1 and 2 of the BGA results using CA for the serine protease alignment using the binary encoding showing both residues and sequences. Extreme residues are labelled. The trypsin sequences are plotted in green, chymotrypsin sequences in red and elastase sequences in blue, while residues are plotted in black. Positions that are thought to be in the binding pocket are circled in red.
Figure 10
Figure 10
Axis 1 and axis 2 of the BGA results using PCA with the AAP encoding. Sequences are shown in A). Residues are shown in B).

Similar articles

Cited by

References

    1. Yuan L, Voelker TA, Hawkins DJ. Modification of the substrate specificity of an acyl-acyl carrier protein thioesterase by protein engineering. Proc Natl Acad Sci U S A. 1995;92:10639–10643. doi: 10.1073/pnas.92.23.10639. - DOI - PMC - PubMed
    1. del Sol Mesa A, Pazos F, Valencia A. Automatic methods for predicting functionally important residues. J Mol Biol. 2003;326:1289–1302. doi: 10.1016/S0022-2836(02)01451-1. - DOI - PubMed
    1. Gu X, Vander Velden K. DIVERGE: phylogeny-based analysis for functional-structural divergence of a protein family. Bioinformatics. 2002;18:500–501. doi: 10.1093/bioinformatics/18.3.500. - DOI - PubMed
    1. Edwards RJ, Shields DC. BADASP: predicting functional specificity in protein families using ancestral sequences. Bioinformatics. 2005;21:4190–4191. doi: 10.1093/bioinformatics/bti678. - DOI - PubMed
    1. Lichtarge O, Bourne HR, Cohen FE. An evolutionary trace method defines binding surfaces common to protein families. J Mol Biol. 1996;257:342–358. doi: 10.1006/jmbi.1996.0167. - DOI - PubMed

Publication types

MeSH terms

LinkOut - more resources