

Transcription-related mutations and GC content drive variation in nucleotide substitution rates across the genomes of Arabidopsis thaliana and Arabidopsis lyrata
- PMID: 17451608
- PMCID: PMC1865379
- DOI: 10.1186/1471-2148-7-66
Transcription-related mutations and GC content drive variation in nucleotide substitution rates across the genomes of Arabidopsis thaliana and Arabidopsis lyrata
Abstract
Background: There has been remarkably little study of nucleotide substitution rate variation among plant nuclear genes, in part because orthology is difficult to establish. Orthology is even more problematic for intergenic regions of plant nuclear genomes, because plant genomes generally harbor a wealth of repetitive DNA. In theory orthologous intergenic data is valuable for studying rate variation because nucleotide substitutions in these regions should be under little selective constraint compared to coding regions. As a result, evolutionary rates in intergenic regions may more accurately reflect genomic features, like recombination and GC content, that contribute to nucleotide substitution.
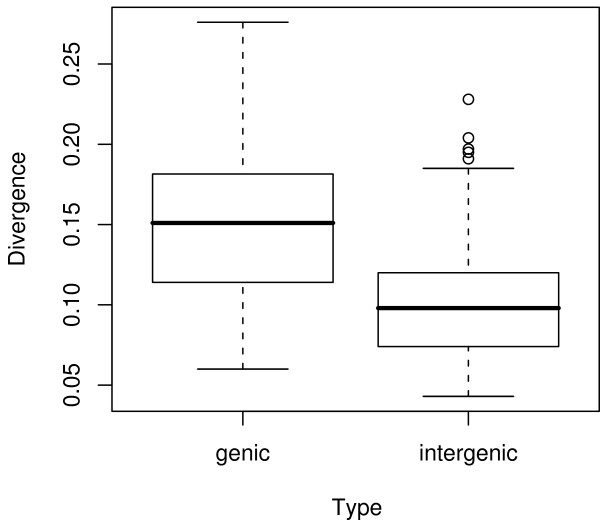
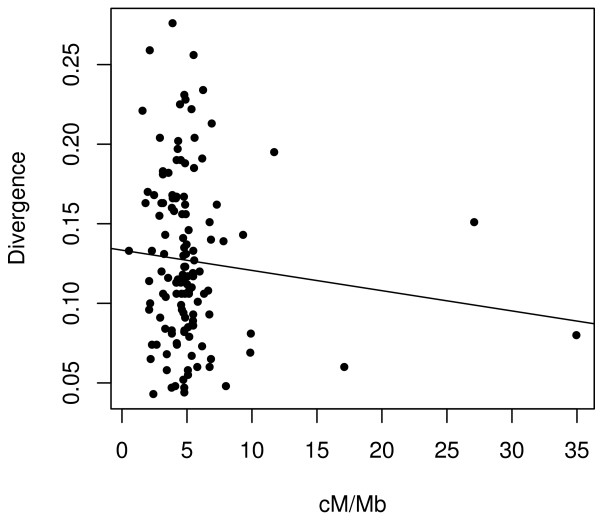
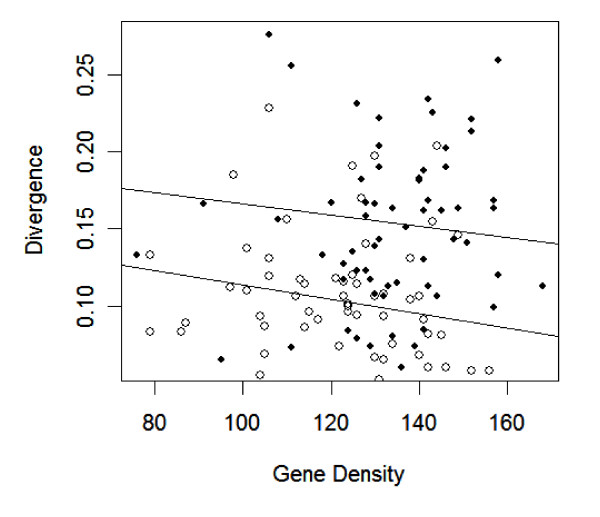
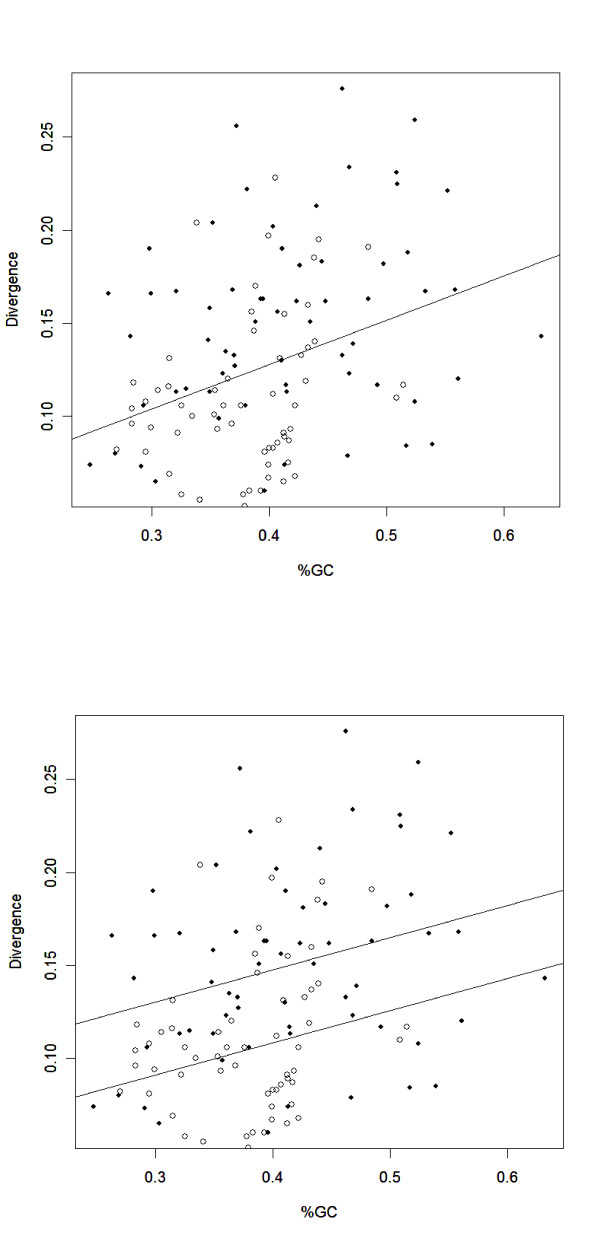
Results: We generated a set of 66 intergenic sequences in Arabidopsis lyrata, a close relative of Arabidopsis thaliana. The intergenic regions included transposable element (TE) remnants and regions flanking the TEs. We verified orthology of these amplified regions both by comparison of existing A. lyrata--A. thaliana genetic maps and by using molecular features. We compared substitution rates among the 66 intergenic loci, which exhibit ~5-fold rate variation, and compared intergenic rates to a set of 64 orthologous coding sequences. Our chief observations were that the average rate of nucleotide substitution is slower in intergenic regions than in synonymous sites, that rate variation in both intergenic and coding regions correlate with GC content, that GC content alone is not sufficient to explain differences in rates between intergenic and coding regions, and that rates of evolution in intergenic regions correlate negatively with gene density.
Conclusion: Our observations indicated that mutation rates vary among genomics regions as a function of base composition, suggesting that previous observations of "selective constraint" on non-coding regions could more accurately be attributed to a GC effect instead of selection. The negative correlation between nucleotide substitution rate and gene density provides a potential neutral explanation for a previously documented correlation between gene density and polymorphism levels within A. thaliana. Finally, we discuss potential forces that could contribute to rapid synonymous rates, and provide evidence to suggest that transcription-related mutation contributes to rate differences between intergenic and synonymous sites.
Figures
Similar articles
-
Patterns of nucleotide substitution among simultaneously duplicated gene pairs in Arabidopsis thaliana.Mol Biol Evol. 2002 Sep;19(9):1464-73. doi: 10.1093/oxfordjournals.molbev.a004209. Mol Biol Evol. 2002. PMID: 12200474
-
Effects of recombination rate and gene density on transposable element distributions in Arabidopsis thaliana.Genome Res. 2003 Aug;13(8):1897-903. doi: 10.1101/gr.1281503. Genome Res. 2003. PMID: 12902382 Free PMC article.
-
Coding DNA repeated throughout intergenic regions of the Arabidopsis thaliana genome: evolutionary footprints of RNA silencing.Mol Biosyst. 2009 Dec;5(12):1679-87. doi: 10.1039/b903031j. Epub 2009 Apr 30. Mol Biosyst. 2009. PMID: 19452047
-
Angiosperm mitochondrial genomes and mutations.Mitochondrion. 2008 Jan;8(1):5-14. doi: 10.1016/j.mito.2007.10.006. Epub 2007 Nov 4. Mitochondrion. 2008. PMID: 18065297 Review.
-
Epigenetic control of transposon transcription and mobility in Arabidopsis.Curr Opin Plant Biol. 2012 Nov;15(5):503-10. doi: 10.1016/j.pbi.2012.08.006. Epub 2012 Aug 31. Curr Opin Plant Biol. 2012. PMID: 22940592 Review.
Cited by
-
Distribution, diversity, evolution, and survival of Helitrons in the maize genome.Proc Natl Acad Sci U S A. 2009 Nov 24;106(47):19922-7. doi: 10.1073/pnas.0908008106. Epub 2009 Nov 19. Proc Natl Acad Sci U S A. 2009. PMID: 19926865 Free PMC article.
-
Parasitic plants have increased rates of molecular evolution across all three genomes.BMC Evol Biol. 2013 Jun 19;13:126. doi: 10.1186/1471-2148-13-126. BMC Evol Biol. 2013. PMID: 23782527 Free PMC article.
-
Recent spread of a retrotransposon in the Silene latifolia genome, apart from the Y chromosome.Genetics. 2009 Feb;181(2):811-7. doi: 10.1534/genetics.108.099267. Epub 2008 Dec 8. Genetics. 2009. PMID: 19064703 Free PMC article.
-
Molecular evolution of genes encoding allergen proteins in the peanuts genus Arachis: Structural and functional implications.PLoS One. 2019 Nov 1;14(11):e0222440. doi: 10.1371/journal.pone.0222440. eCollection 2019. PLoS One. 2019. PMID: 31675366 Free PMC article.
-
The Dynamics, Causes, and Impacts of Mammalian Evolutionary Rates Revealed by the Analyses of Capybara Draft Genome Sequences.Genome Biol Evol. 2020 Aug 1;12(8):1444-1458. doi: 10.1093/gbe/evaa157. Genome Biol Evol. 2020. PMID: 32835375 Free PMC article.
References
-
- Duret L, Mouchiroud D. Determinants of Substitution Rates in Mammalian Genes: Expression Pattern Affects Selection Intensity but Not Mutation Rate. Mol Biol Evol. 2000;17:68–70. - PubMed
Publication types
MeSH terms
Substances
LinkOut - more resources
Full Text Sources
Research Materials
Miscellaneous
