Optimization and validation of an 8-color intracellular cytokine staining (ICS) assay to quantify antigen-specific T cells induced by vaccination
- PMID: 17451739
- PMCID: PMC2683732
- DOI: 10.1016/j.jim.2007.03.002
Optimization and validation of an 8-color intracellular cytokine staining (ICS) assay to quantify antigen-specific T cells induced by vaccination
Abstract
Candidate HIV-1 vaccines currently being evaluated in clinical trials are designed to elicit HIV-1-specific cellular immunity. Intracellular cytokine staining (ICS) assays allow sensitive, quantitative ex vivo assessments of antigen-specific T cells including immunophenotyping of responding cells and measurement of multiple effector functions. Additionally, the use of banked cryopreserved PBMC samples makes this assay attractive in the setting of large efficacy trials where it is less feasible to perform immunoassays on freshly isolated samples. Here we describe extensive studies to optimize and quantitatively validate the 8-color ICS assay for use in clinical trials of candidate vaccines, which includes measurement of viable IFN-gamma, IL-2, TNF-alpha and IL-4 producing CD4+ and CD8+ T cells. We show that omission of viability dye staining results in an over-estimate of the true antigen-specific T cell response by up to two-fold. After optimization, the 8-color assay was validated for specificity, precision, linearity, limit of quantitation and robustness. The assay has a lower quantitation limit generally below 0.04%, depending on the cytokine subset. Additionally, with appropriate gating, the 8-color assay gives comparable cytokine-positive responses to those observed with the conventional 4-color assay. In conclusion, we provide the first description of a quantitatively validated ICS assay, which permits quantitative and qualitative evaluation of vaccine-induced immunogenicity and analysis of immune correlates of protection.
Figures


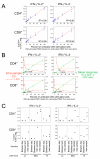
 -γ and IL-2 (left panels) or only IFN-γ (right panels) for either CD4+ T cells (upper) or CD8+ T cells (lower) are shown. The Y-axis shows the percentage of CD4+ or CD8+ T cells producing the indicated cytokine(s). The cell dilution is shown on the X-axis as the percentage of undiluted CMV-stimulated cells in the dilution. The intra-sample variability in this one experiment is visualized by the range of responses at each dilution level. The standard least squares correlation is listed. B. The CV for measurement of cytokine responses increases as the level of the cytokine response decreases and the limit of quantitation is determined as the lowest cytokine response for which the CV remains ≤30%. Shown is one of the experiments used to determine limit of quantitation. These are the same experiments used to determine linearity, and the four cytokine subsets are shown as in Figure 6A. Data shown here are from the PBMC donor with the high CMV response. The triplicates at each dilution level are averaged (shown in green), and the scale for this mean response is shown on the right vertical axis. The red line denotes the intra-sample CV at each dilution level for each cytokine subset. The scale for the CV is shown on the left vertical axis. The dashed red line indicates the acceptable upper limit of CV, 30%. The arrow points to the lowest mean cytokine response for which the CV is below 30%. C. The limit of quantitation is calculated for each type of variation for each PBMC sample and for each cytokine subset. Cells producing both IF
 -γ and IL-2 (left panels) or only IFN-γ (right panels) for either CD4+ T cells (upper) or CD8+ T cells (lower) are shown. The type of variation is shown on the X-axis grouped by the three PBMC donors with low, medium or high CMV responses. For the medium responder, an additional type of variation, inter-sample, was evaluated. The limit of quantitation is shown on the Y-axis as the percent of CD4+ or CD8+ T cells. This was determined as in Figure 6B, i.e., the lowest cytokine response for which the CV remains ≤30%. One high outlier (0.6%, marked as *) was removed for the intra-sample analysis of the medium donor for the CD8+ IFN-γ+IL-2- T cell response.
References
-
- Bach MK, Brashler JR. Isolation of subpopulations of lymphocytic cells by the use of isotonically balanced solutions of Ficoll. I. Development of methods and demonstration of the existence of a large but finite number of subpopulations. Exp Cell Res. 1970;61:387–96. - PubMed
-
- Boyum A. Isolation of lymphocytes, granulocytes and macrophages. Scand J Immunol Suppl. 1976;5:9–15. - PubMed
-
- Burton DR, Desrosiers RC, Doms RW, Koff WC, Kwong PD, Moore JP, Nabel GJ, Sodroski J, Wilson IA, Wyatt RT. HIV vaccine design and the neutralizing antibody problem. Nat Immunol. 2004;5:233–6. - PubMed
-
- Cohen J. Public health. AIDS vaccine trial produces disappointment and confusion. Science. 2003;299:1290–1. - PubMed
Publication types
MeSH terms
Substances
Grants and funding
LinkOut - more resources
Full Text Sources
Other Literature Sources
Research Materials

