. 2007 Jul 21;247(2):371-81.
doi: 10.1016/j.jtbi.2007.03.006. Epub 2007 Mar 14.

Modeling hepatitis C virus dynamics: liver regeneration and critical drug efficacy

Affiliations

Modeling hepatitis C virus dynamics: liver regeneration and critical drug efficacy

Harel Dahari et al. J Theor Biol. .

Abstract

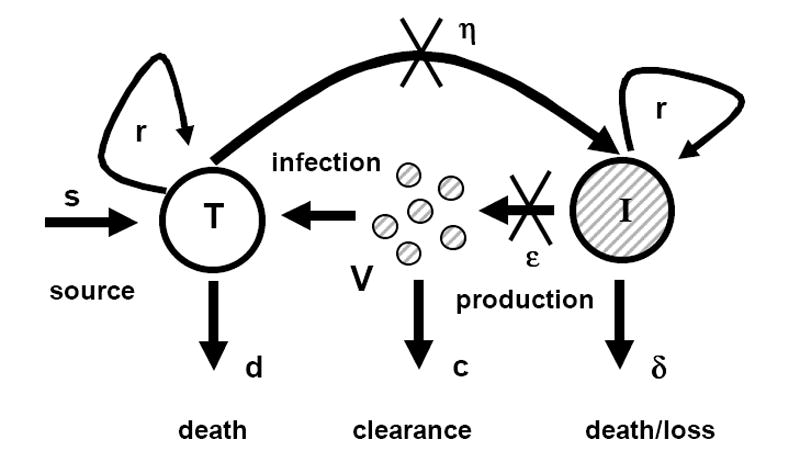
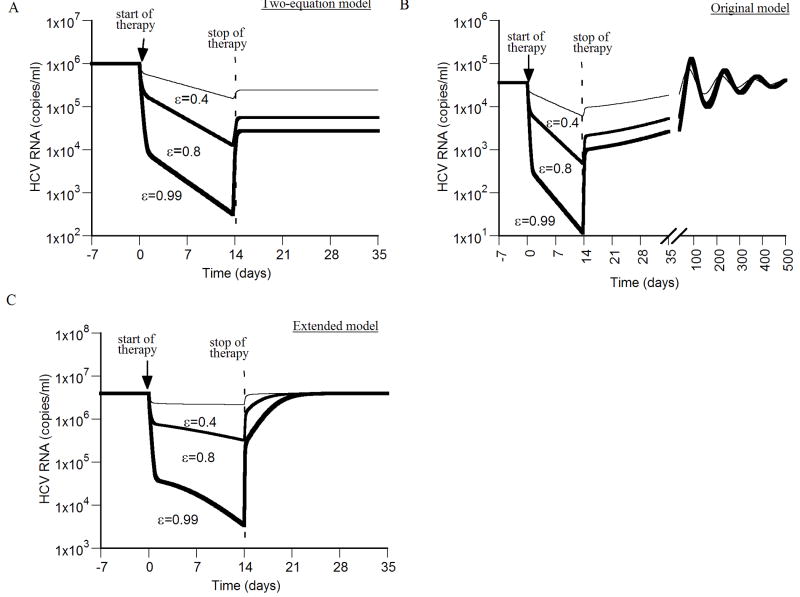
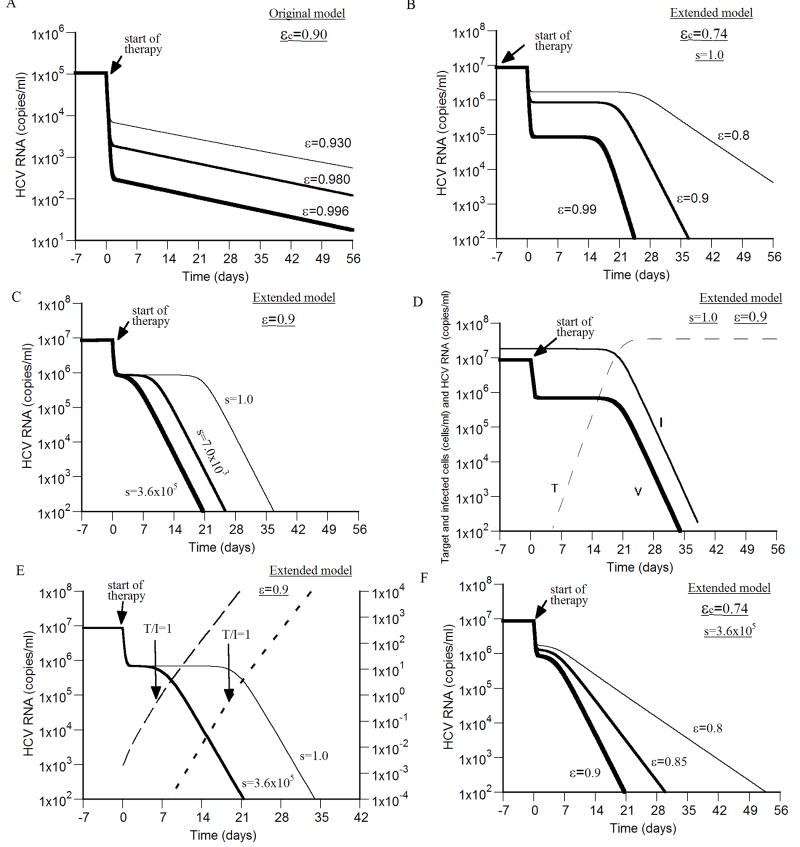
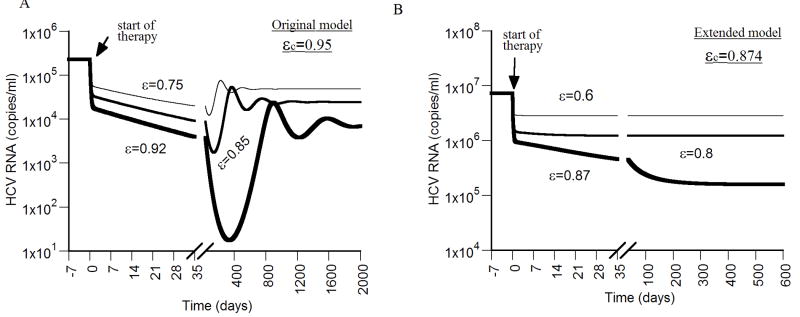
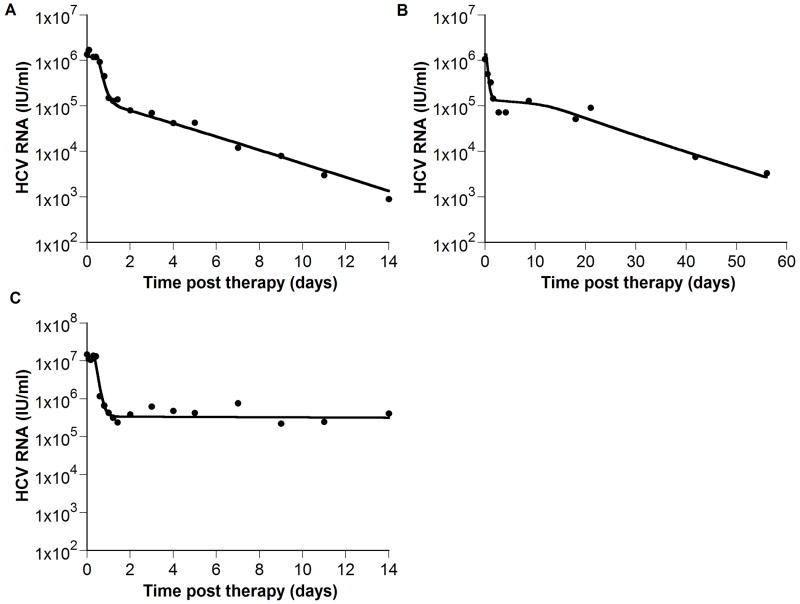
Mathematical models for hepatitis C viral (HCV) RNA kinetics have provided a means of evaluating the antiviral effectiveness of therapy, of estimating parameters such as the rate of HCV RNA clearance, and they have suggested mechanism of action against HCV for both interferon and ribavirin. Nevertheless, the model that was originally formulated by Neumann et al. [1998. Hepatitis C viral dynamics in vivo and the antiviral efficacy of interferon-alpha therapy. Science 282 (5386), 103-107] is unable to explain all of the observed HCV RNA profiles under treatment e.g., a triphasic viral decay and a viral rebound to baseline values after the cessation of therapy. Further, the half-life of productively HCV-infected cells, estimated from the second phase HCV RNA decline slope, is very variable and sometimes zero with no clear understanding of why. We show that extending the original model by including hepatocyte proliferation yields a more realistic model without any of these deficiencies. Further, we define and characterize a critical drug efficacy, such that for efficacies above the critical value HCV is ultimately cleared, while for efficacies below it, a new chronically infected viral steady-state level is reached.


Figures

Figure 1
Figure 1. Diagrammatic representation of the model of chronic viral infection
The original Neumann et al. (1998) model assumes that there is no proliferation of target and infected cells (i.e., r=0). The extended model that we introduce here accounts for target and infected cell proliferation (i.e., r > 0). T, and I represent target and infected cells, respectively, and V represents free virus.
Figure 2
Figure 2. Viral kinetics after therapy cessation
We simulated virus resurgence post therapy cessation using the two-equation model (A), the original model (B), and the extended model (C). Different drug efficacies (ε = 0.4, 0.8 and 0.99) were assigned at time 0 for 14 days, and then set to ε=0 for the rest of the simulation. In all simulations the following parameters were held fixed: d = 0.0026 day-1, p = 2.9 virions/day, β = 2.25×10⁻⁷ ml day-1 virions-1, c = 6.0 day-1, δ = 0.26 day-1. A) During therapy (ε > 0) the virus concentration V(t) can be calculated using Eq. (7). Here the initial condition V(0) = V0 = 106/ml was used. Upon cessation of therapy at time te = 14 days, V increases from V(te) to a new steady-state level V(te)/(1-ε), but not to its pretreatment level, as explained in section 2.1.4. B) Using the original model, with s = 2.6×10⁴ cell ml-1 day-1, the virus resurges to pretreatment levels with damped oscillations. The curve for virus increase after therapy cessation with drug efficacies of ε = 0.99 and ε = 0.8 largely superimpose. The virus resurges to pretreatment viral load levels in a significant shorter time with higher values of p and/or β (not shown). C) Using the extended model, with s = 2.6×10⁴ cell ml-1 day-1, r = 4.2 day-1 and Tmax = 1.0 × 10⁷ cells, the virus resurges to pretreatment levels within a week post therapy cessation.
Figure 3
Figure 3. Viral kinetics during successful antiviral treatment
We simulated virus decay during therapy using the original model (A), and the extended model (B - F), with different drug efficacies higher than the critical efficacy (ε > εc), and (unless otherwise stated) d = 0.01 day-1, p = 2.9 virions/day, β = 2.25×10⁻⁷ ml day-1 virions-1, δ = 1.0 day-1, c = 6.0 day-1, r = 2.0 day-1, s=1.0 cell ml-1 day-1 and Tmax = 3.6 × 10⁷ cells ml-1. A) With drug efficacies (i.e., ε = 0.93, 0.98 and 0.996) higher than the critical efficacy (εc=0.90), a biphasic viral decline is shown which lead to viral eradication. Based on simulation results, the second phase viral decline slopes under the three efficacies (i.e., ε=0.93, 0.98 and 0.996) are 0.047 day-1, 0.050 day-1 and 0.051 day-1, respectively (i.e., 91%, 98% and 99% of the death rate of infected cells used here (δ = 0.052 day-1). Tmax = 1.0 × 10⁷ cells ml-1, s=2.6×10⁴ cell ml-1 day-1 and d = 0.0026 day-1. B) With drug efficacies (i.e., ε = 0.80, 0.90 and 0.99) higher than the critical efficacy (εc=0.74), a triphasic viral decay is shown that consists of a first phase with rapid virus decline followed by a “shoulder phase” in which virus load remains constant and a third phase of faster viral decay. For the three efficacies 0.80, 0.90 and 0.99 the third phase viral decline slopes are 0.04 day-1, 0.34 day-1 and 0.82 day-1, respectively, i.e., 4%, 34% and 82% of the infected cell death rate used here (δ=1.0 day-1). C) Higher influx rates of new hepatocytes, s, shrinks the “shoulder phase” and even eliminates it giving rise to a biphasic viral decline. The drug efficacy was fixed, ε=0.90, in the three simulation curves. Note, over a large range of values for s, i.e., 1.0×10⁵ - 3.6×10⁵ cells ml-1 day-1, with the above parameter values, the critical drug efficacy εc = 0.742 − 0.743, and thus does not change significantly. D) The viral (thick line) shoulder phase is maintained by a quasi-steady-state level of infected cells (thin line) until the target cell population level (dashed line) reaches that of infected cell population. E) A shoulder phase is observed when the level of infected cells is much higher than the target cell level at baseline (i.e., T/I ≪ 1 before therapy; (short-dashed line)). The shoulder phase ends when T/I ~ 1. T/I ratio for the shorter shoulder-phase is represented by a long-dashed line. F) With a higher influx rate of new hepatocytes, s = 3.6×10⁵ cell ml-1 day-1, and drug efficacies ε = 0.80, 0.85 and 0.90, higher than the critical efficacy (εc=0.74), a biphasic viral decay is shown that leads to viral eradication. The second phase viral decline slopes for the three efficacies ε = 0.80, 0.85 and 0.90 are 0.20 day-1, 0.38 day-1 and 0.57 day-1, respectively, i.e., 20%, 38% and 57% of the infected cell death rate used here (δ=1.0 day-1).
Figure 4
Figure 4. Viral kinetics with drug efficacy below the critical efficacy
We simulated virus decay during therapy using the original model (A), and the extended model (B), with different drug efficacies below the critical efficacy (ε < εc), and η = 0, d = 0.0026 day-1, p = 2.9 virions/day, β = 2.25×10⁻⁷ ml day-1 virions-1, and c = 6.0 day-1. The critical efficacies for the original model and the extended model were calculated using Eqs. (17) and (29), respectively. With the original model, (A), after an initial rapid viral decrease upon start of therapy, the virus decays in a slower second phase during the first weeks of therapy until it reaches a viral nadir and then rebounds to a lower viral plateau. Higher values of p and/or β lead to shorter times until the lower plateau is reached (not shown). In (A), δ = 0.052 day-1 and s = 2.6×10⁴ cell ml-1 day-1. With the extended model (B), after a rapid viral decrease upon start of therapy, the virus decays in a slower phase during the first weeks of therapy until it reaches a lower viral plateau. A lower value of r, e.g.,<0.05 day-1, leads to viral oscillation, until it reaches the lower viral plateau (not shown). δ = 0.26 day-1, Tmax = 1.0×10⁷ cells, s = 2.6×10⁵ cell ml-1 day-1 and r = 1.0 day-1.
Figure 5
Figure 5. The model is consistent with experimental data
(●) exhibiting biphasic (A), triphasic (B) and flat partial (C) viral decays. We fit (A) HCV RNA levels from a chronic HCV patient treated with interferon α-2b from Neumann et al., 1998, (B) digitized HCV RNA levels of a patient treated with pegylated interferon α-2a (shown in figure 2B of Hermann et al., 2003), and (C) HCV RNA levels from a second patient treated with interferon α-2b from Neumann et al., 1998. The analytical solution for V(t), i.e., Eq. (7) in Neumann et al., 1998 was first fitted to the HCV RNA, using Berkeley-Madonna (version 7.0.2; www.berkeleymadonna.com), to estimate the delay time before viral decay begins, t0, the IFN effectiveness, ε, and the viral clearance rate constant, c. Then, we fitted our model (Eqs. 24 - 26; solid line) to the HCV RNA data (●) with t0, ε, and c held fixed at their previously estimated values, and found values for the parameters s, d, δ, p, r, Tmax, and β for each patient that generated viral load decays consistent with the data. Parameter values found in (A), (B) and (C) respectively are: Tmax = 0.7 × 10⁷, 0.51 × 10⁷ and 0.6 × 10⁷ ml-1; s = 8.0 × 10⁵, 1.5 × 10³ and 3.7 × 10⁴ day-1 ml-1; d = 4.7 × 10⁻³, 9.3 × 10⁻³ and 2.4 × 10⁻³ day-1; δ = 0.30, 0.49 and 0.06 day-1; β = 0.6 × 10⁻⁷, 3.8 × 10⁻⁷ and 1.8 × 10⁻⁷ virions-1 day-1; r = 0.45, 0.54, and 0.73 day-1; c = 5.9, 3.5, and 13.9 day-1; t0 = 0.6, 0.3, and 0.4 days; p = 5.4, 7.1 and 13.9 virions day-1; ε = 0.906, 0.899 and 0.9675.

Similar articles

Cited by

References

    1. Alter MJ, Margolis HS, Krawczynski K, Judson FN, Mares A, Alexander WJ, Hu PY, Miller JK, Gerber MA, Sampliner RE. The natural history of community-acquired hepatitis C in the United States. The Sentinel Counties Chronic non-A, non-B Hepatitis Study Team. N Engl J Med. 1992;327(27):1899–1905. - PubMed
    1. Bekkering FC, Neumann AU, Brouwer JT, Levi-Drummer RS, Schalm SW. Changes in anti-viral effectiveness of interferon after dose reduction in chronic hepatitis C patients: a case control study. BMC Gastroenterol. 2001;1:14. - PMC - PubMed
    1. Callaway DS, Perelson AS. HIV-1 infection and low steady state viral loads. Bull Math Biol. 2002;64(1):29–64. - PubMed
    1. Colombatto P, Civitano L, Oliveri F, Coco B, Ciccorossi P, Flichman D, Campa M, Bonino F, Brunetto MR. Sustained response to interferon-ribavirin combination therapy predicted by a model of hepatitis C virus dynamics using both HCV RNA and alanine aminotransferase. Antivir Ther. 2003;8(6):519–530. - PubMed
    1. Dahari H, Feliu A, Garcia-Retortillo M, Forns X, Neumann AU. Second hepatitis C replication compartment indicated by viral dynamics during liver transplantation. J Hepatol. 2005a;42(4):491–498. - PubMed

Publication types

Substances

LinkOut - more resources