

Role of the basal ganglia and frontal cortex in selecting and producing internally guided force pulses
- PMID: 17451971
- PMCID: PMC1950146
- DOI: 10.1016/j.neuroimage.2007.03.002
Role of the basal ganglia and frontal cortex in selecting and producing internally guided force pulses
Abstract
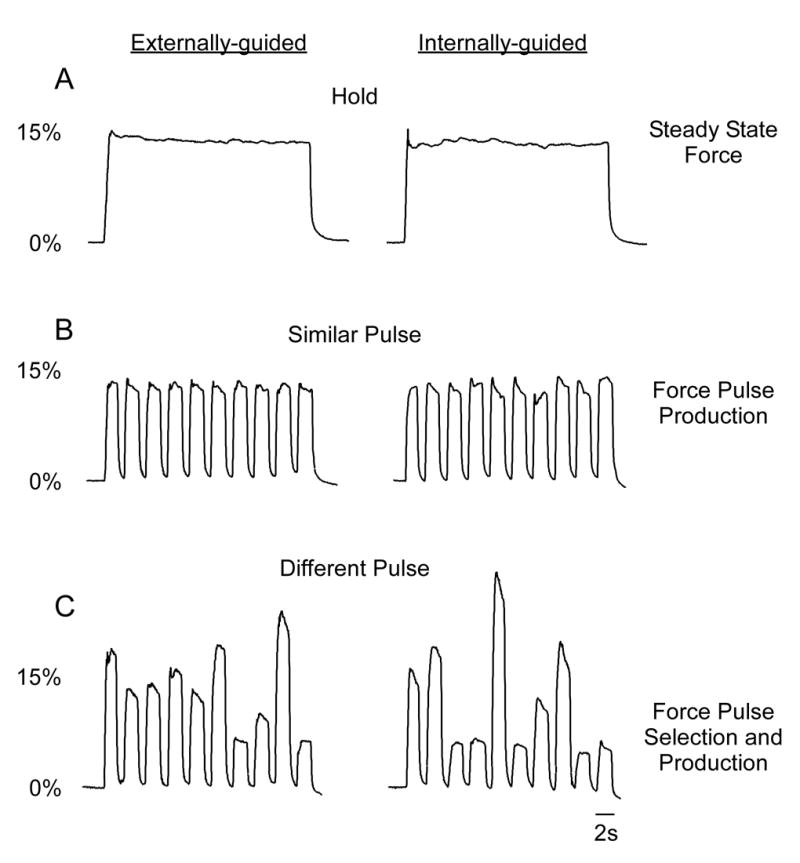
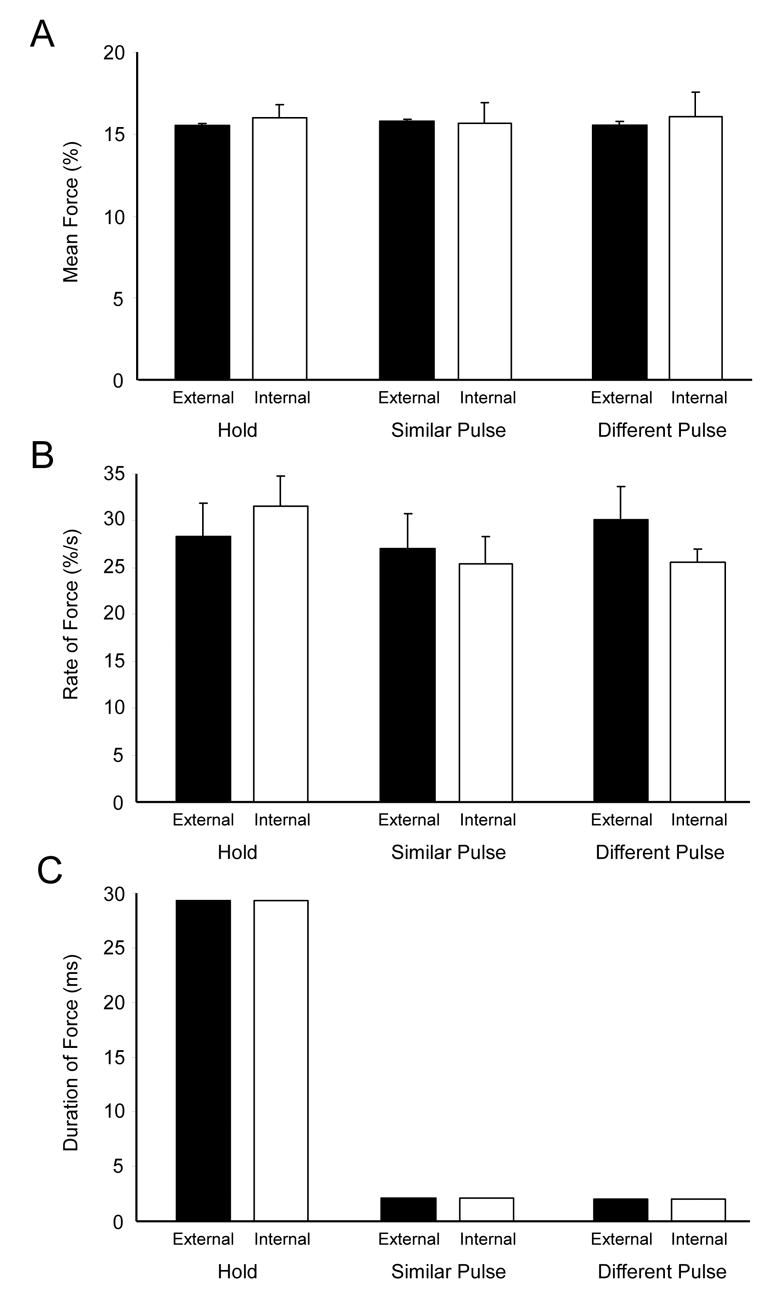
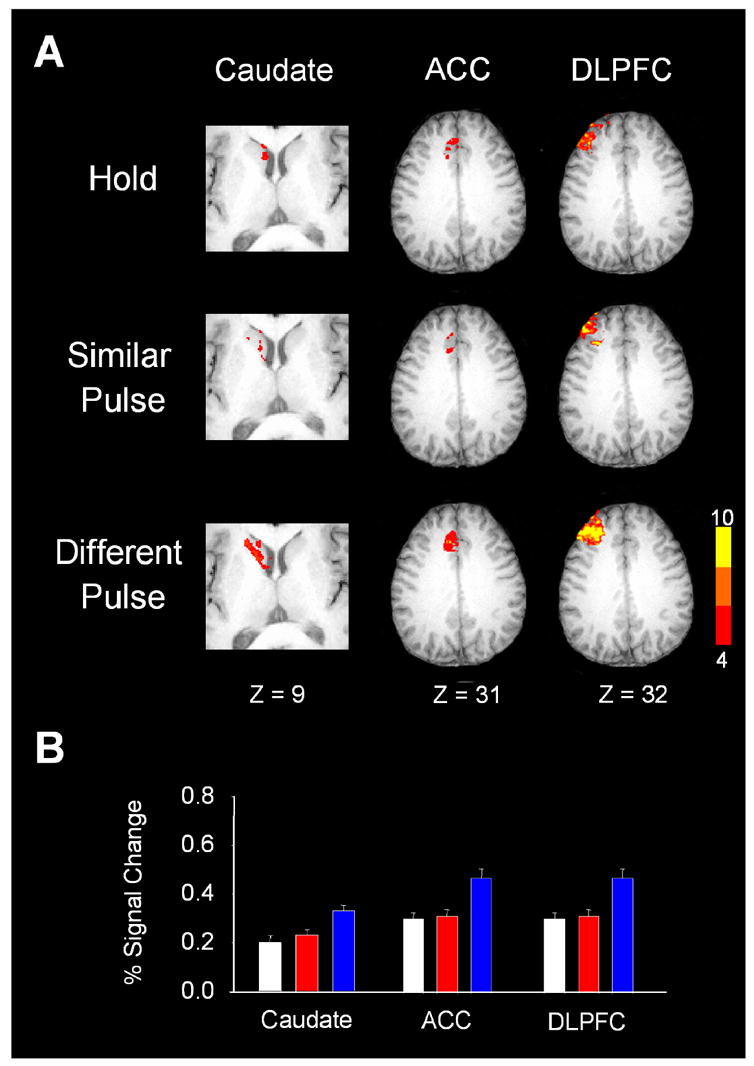
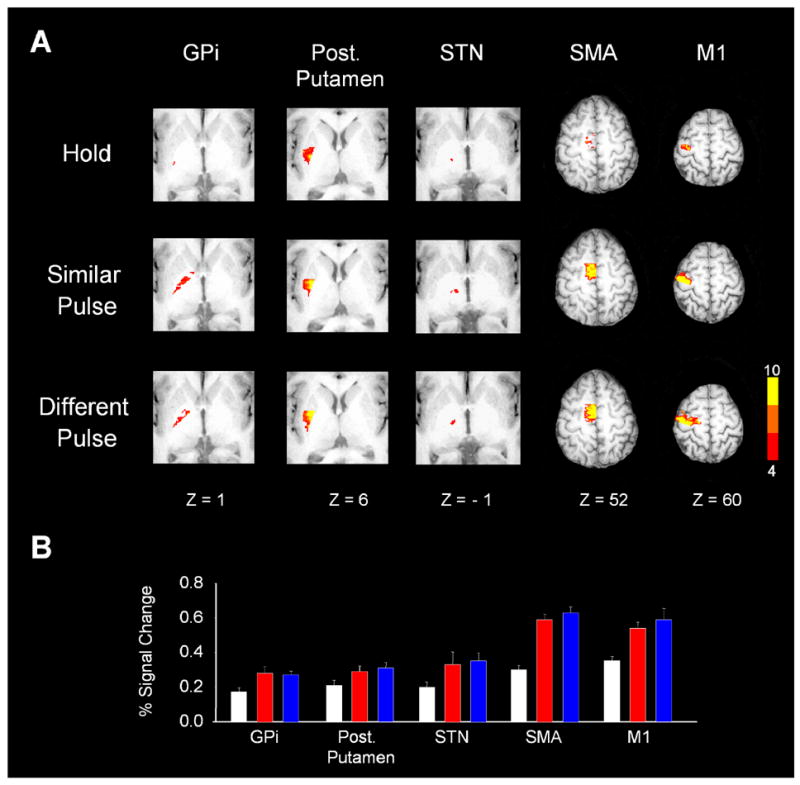
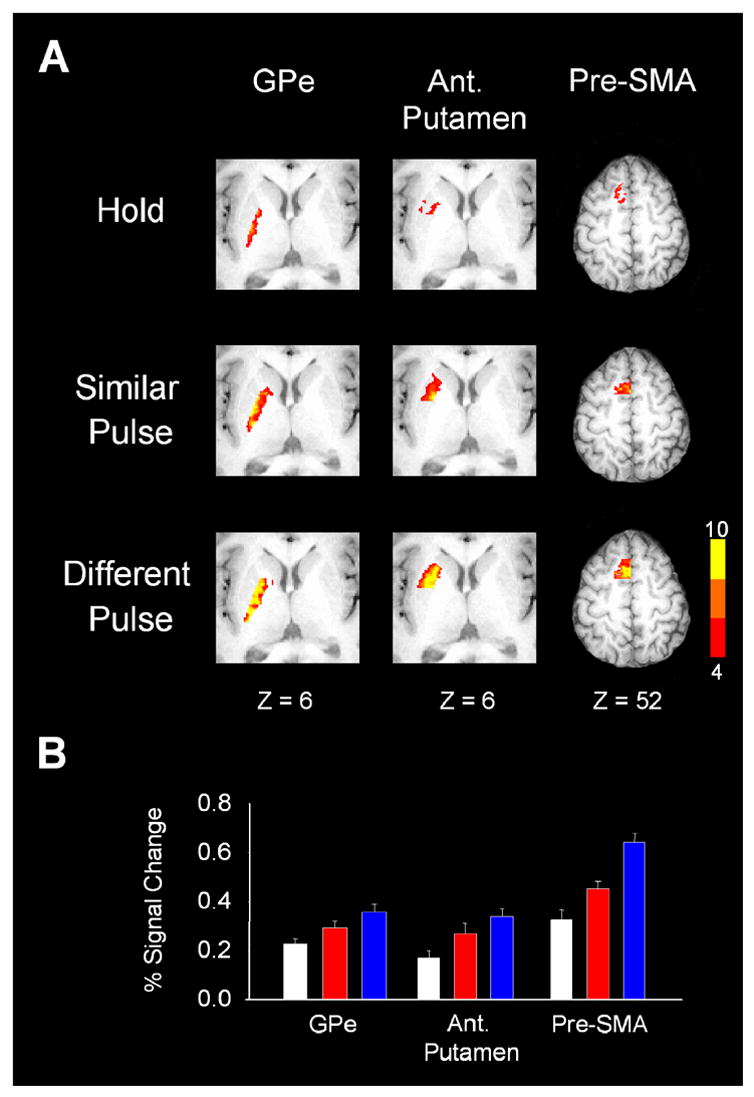
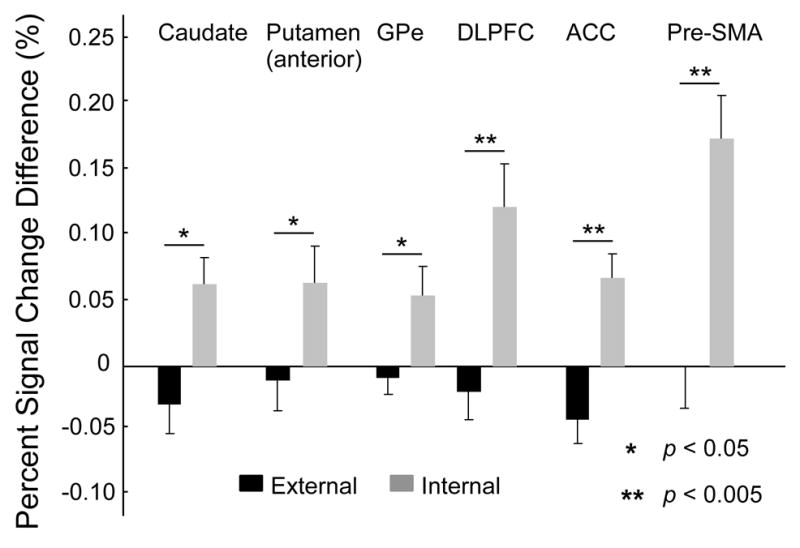
The basal ganglia comprise a crucial circuit involved in force production and force selection, but the specific role of each nucleus to the production of force pulses and the selection of pulses of different force amplitudes remains unknown. We conducted an fMRI study in which participants produced force using a precision grip while (a) holding a steady-state force, (b) performing a series of force pulses with similar amplitude, and (c) selecting force pulses of different amplitude. Region of interest analyses were conducted in the basal ganglia and frontal cortex to compare percent signal change during force pulse versus steady-state force production and compare force amplitude selection to force production when selection of force amplitude was not present. There were three novel findings in the basal ganglia. First, the caudate nucleus increased activation during the selection of different force amplitudes when compared to producing a series of similar force pulses. Second, GPi, STN, and posterior putamen increased activation during the production of similar force amplitudes when compared to holding a steady-state force, and maintained similar activation during the production of different force amplitudes in which force selection was required. Third, GPe and anterior putamen had increased activation during the production of similar force pulses and further increased activation during the selection of different force pulses. These findings suggest that anterior basal ganglia nuclei are involved in selecting the amplitude of force contractions and posterior basal ganglia nuclei regulate basic aspects of dynamic force pulse production.
Figures
Similar articles
-
Role of individual basal ganglia nuclei in force amplitude generation.J Neurophysiol. 2007 Aug;98(2):821-34. doi: 10.1152/jn.00239.2007. Epub 2007 Jun 13. J Neurophysiol. 2007. PMID: 17567775 Free PMC article.
-
Subthalamic nucleus and internal globus pallidus scale with the rate of change of force production in humans.Neuroimage. 2004 Sep;23(1):175-86. doi: 10.1016/j.neuroimage.2004.04.040. Neuroimage. 2004. PMID: 15325364
-
Predicting grip force amplitude involves circuits in the anterior basal ganglia.Neuroimage. 2010 Feb 15;49(4):3230-8. doi: 10.1016/j.neuroimage.2009.11.047. Epub 2009 Nov 26. Neuroimage. 2010. PMID: 19944767 Free PMC article.
-
The connections of the primate subthalamic nucleus: indirect pathways and the open-interconnected scheme of basal ganglia-thalamocortical circuitry.Brain Res Brain Res Rev. 1997 Feb;23(1-2):62-78. doi: 10.1016/s0165-0173(96)00018-5. Brain Res Brain Res Rev. 1997. PMID: 9063587 Review.
-
Basal ganglia outputs and motor control.Ciba Found Symp. 1984;107:83-102. doi: 10.1002/9780470720882.ch6. Ciba Found Symp. 1984. PMID: 6389042 Review.
Cited by
-
A Cortical Mechanism Linking Saliency Detection and Motor Reactivity in Rhesus Monkeys.J Neurosci. 2024 Jan 3;44(1):e0422232023. doi: 10.1523/JNEUROSCI.0422-23.2023. J Neurosci. 2024. PMID: 37949654 Free PMC article.
-
In a visual inverted pendulum balancing task avoiding impending falls gets harder as we age.Exp Brain Res. 2025 Jan 16;243(2):44. doi: 10.1007/s00221-025-06997-x. Exp Brain Res. 2025. PMID: 39815126 Free PMC article.
-
Weight-specific anticipatory coding of grip force in human dorsal premotor cortex.J Neurosci. 2012 Apr 11;32(15):5272-83. doi: 10.1523/JNEUROSCI.5673-11.2012. J Neurosci. 2012. PMID: 22496573 Free PMC article.
-
The cognitive neuroscience of prehension: recent developments.Exp Brain Res. 2010 Aug;204(4):475-91. doi: 10.1007/s00221-010-2315-2. Epub 2010 Jun 8. Exp Brain Res. 2010. PMID: 20532487 Free PMC article. Review.
-
Basal ganglia involvement in ARX patients: The reason for ARX patients very specific grasping?Neuroimage Clin. 2018 Apr 5;19:454-465. doi: 10.1016/j.nicl.2018.04.001. eCollection 2018. Neuroimage Clin. 2018. PMID: 29984154 Free PMC article.
References
-
- Alexander GE, Delong MR, Strick PL. Parallel organization of functionally segregated circuits linking basal ganglia and cortex. Annual Review of Neuroscience. 1986;9:357–381. - PubMed
-
- Badre D, Wagner AD. Selection, integration, and conflict monitoring; assessing the nature and generality of prefrontal cognitive control mechanisms. Neuron. 2004;41:473–487. - PubMed
-
- Bapi RS, Miyapuram KP, Graydon FX, Doya K. fMRI investigation of cortical and subcortical networks in the learning of abstract and effector-specific representations of motor sequences. Neuroimage 2006 - PubMed
-
- Bevan MD, Magill PJ, Terman D, Bolam JP, Wilson CJ. Move to the rhythm: oscillations in the subthalamic nucleus-external globus pallidus network. Trends Neurosci. 2002;25:525–531. - PubMed
Publication types
MeSH terms
Grants and funding
LinkOut - more resources
Full Text Sources
