

Localization of an NH(2)-terminal disease-causing mutation hot spot to the "clamp" region in the three-dimensional structure of the cardiac ryanodine receptor
- PMID: 17452324
- PMCID: PMC2800043
- DOI: 10.1074/jbc.M700660200
Localization of an NH(2)-terminal disease-causing mutation hot spot to the "clamp" region in the three-dimensional structure of the cardiac ryanodine receptor
Abstract
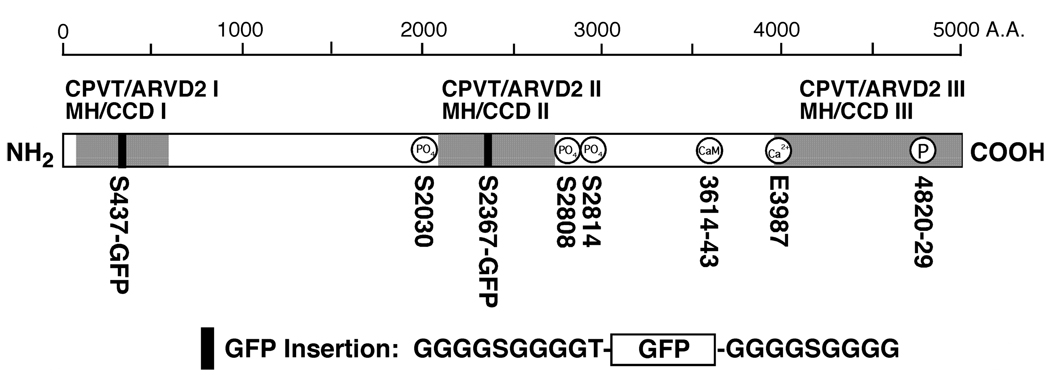
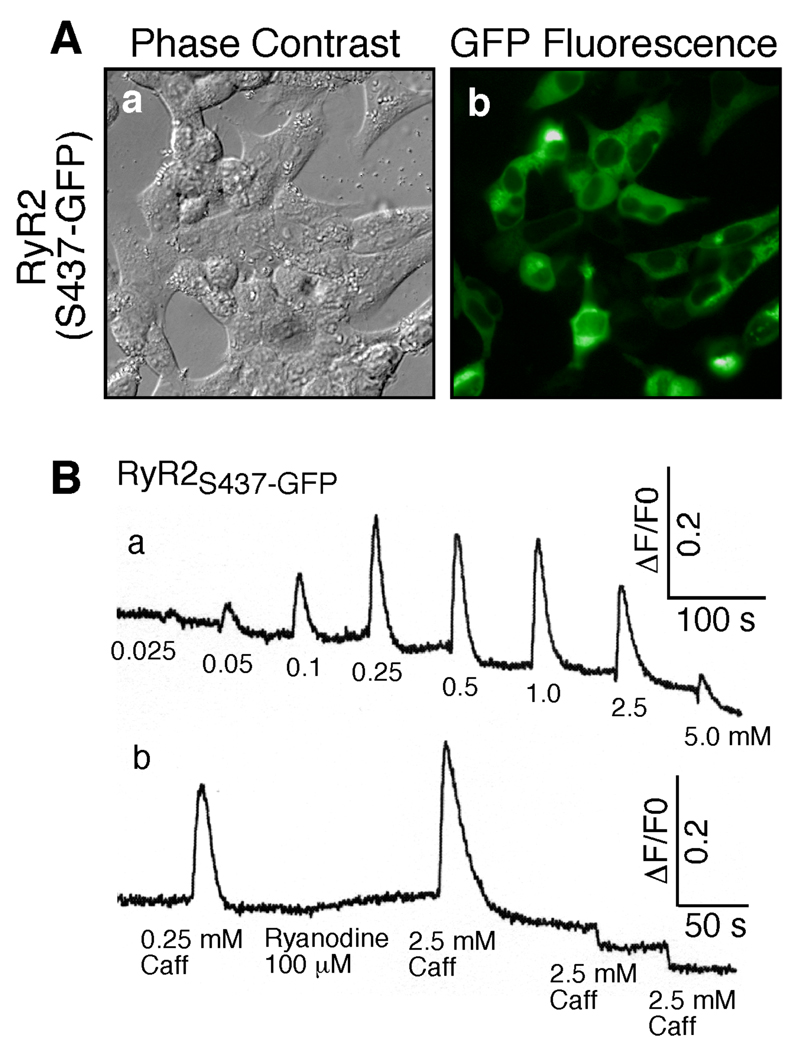
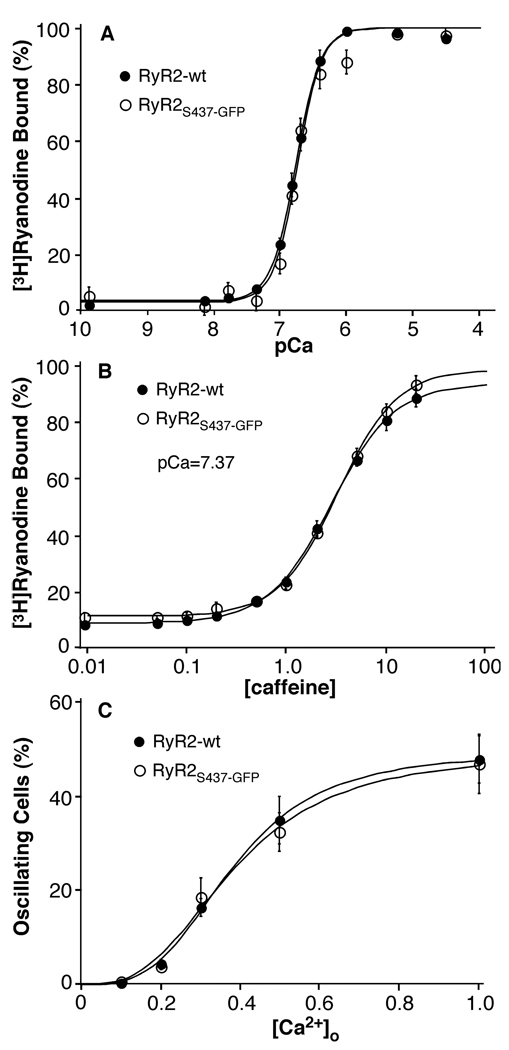
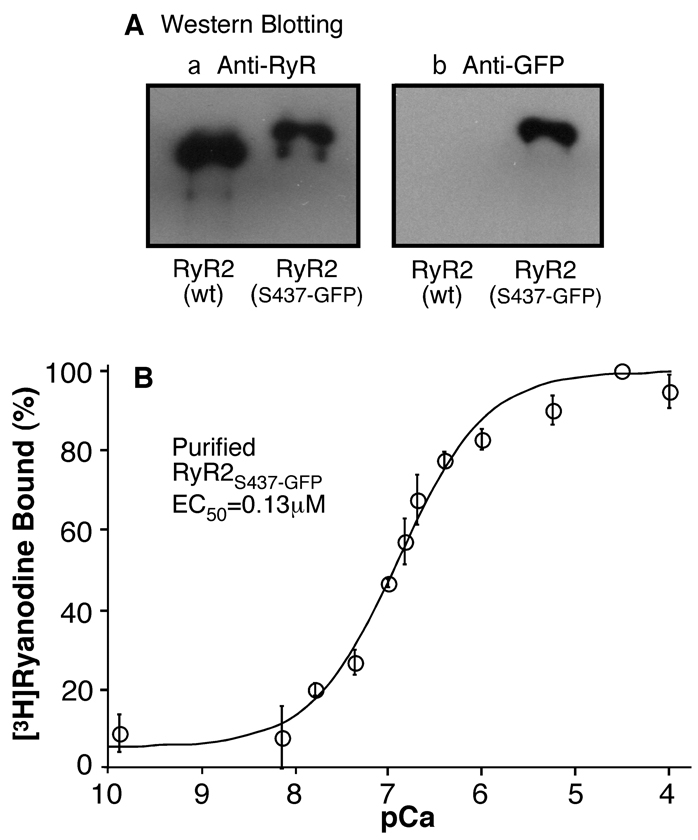
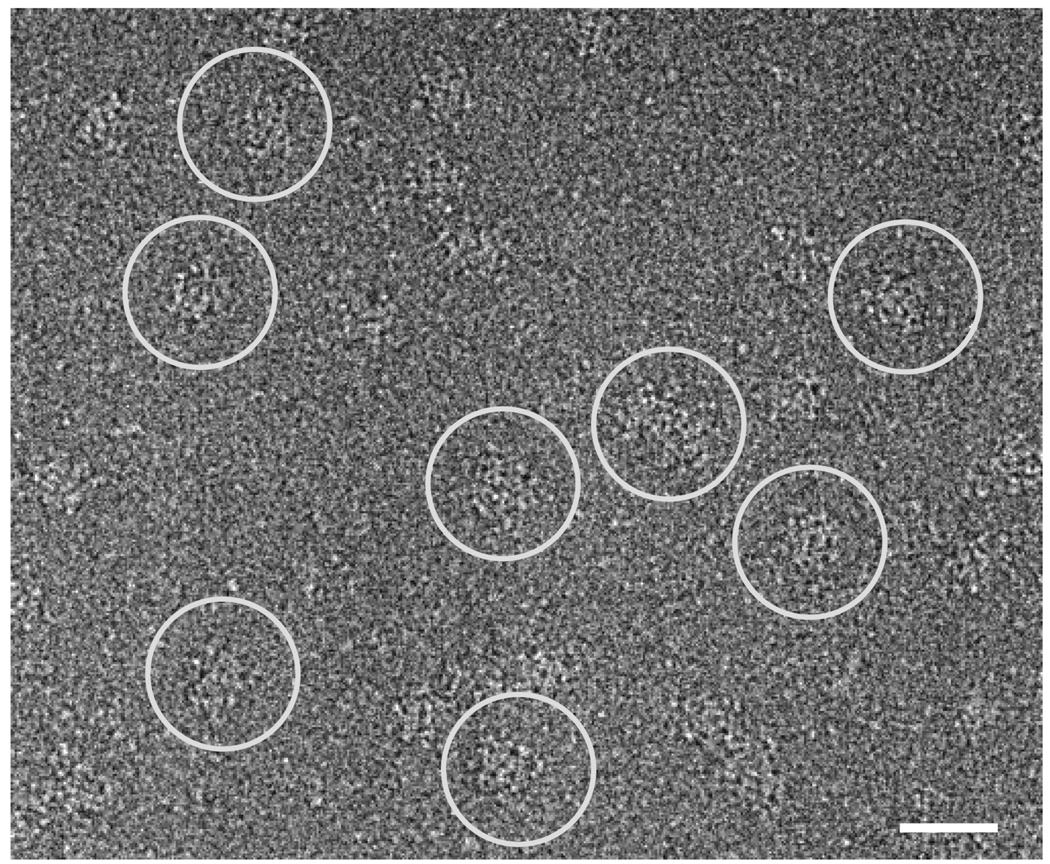
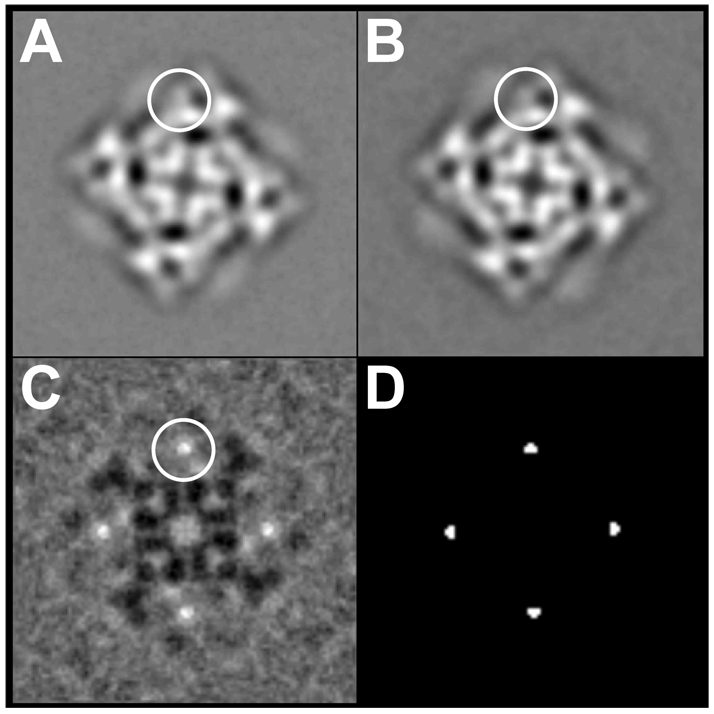
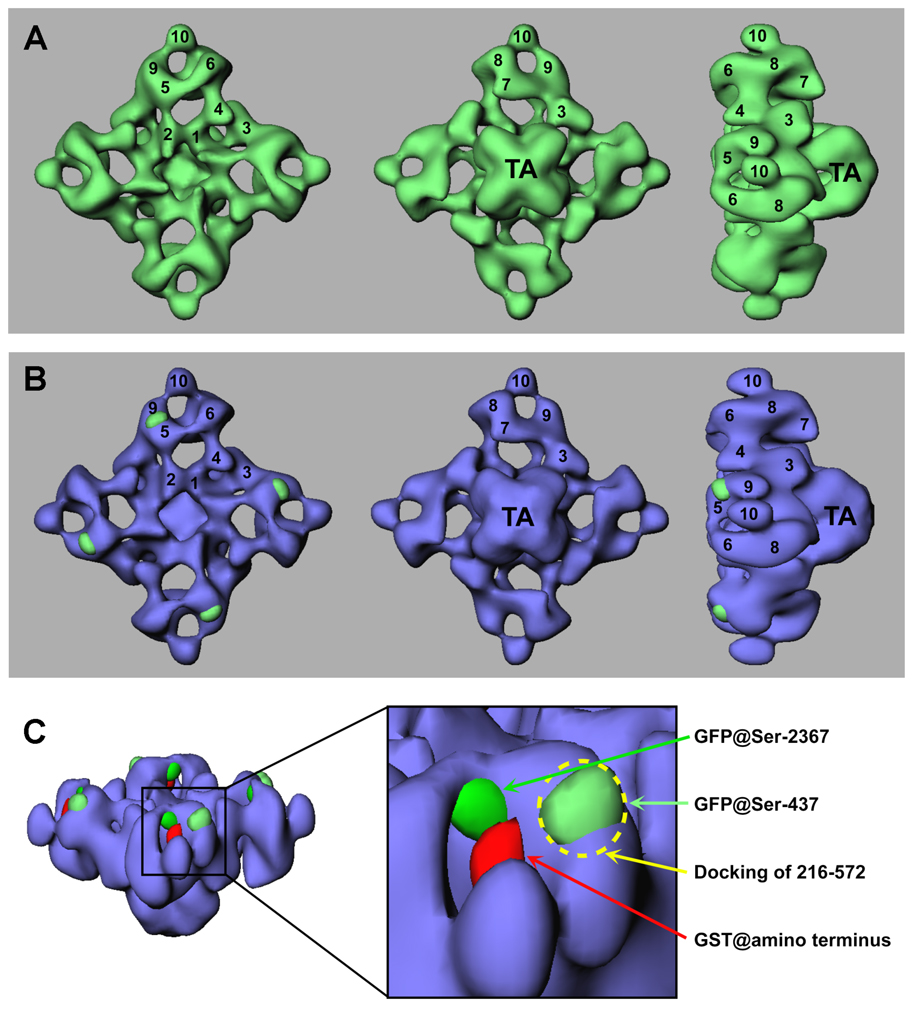
A region between residues 414 and 466 in the cardiac ryanodine receptor (RyR2) harbors more than half of the known NH(2)-terminal mutations associated with cardiac arrhythmias and sudden death. To gain insight into the structural basis of this NH(2)-terminal mutation hot spot, we have determined its location in the three-dimensional structure of RyR2. Green fluorescent protein (GFP), used as a structural marker, was inserted into the middle of this mutation hot spot after Ser-437 in the RyR2 sequence. The resultant GFP-RyR2 fusion protein, RyR2(S437-GFP,) was expressed in HEK293 cells and characterized using Ca(2+) release, [(3)H]ryanodine binding, and single cell Ca(2+) imaging studies. These functional analyses revealed that RyR2(S437-GFP) forms a caffeine- and ryanodine-sensitive Ca(2+) release channel that possesses Ca(2+) and caffeine dependence of activation indistinguishable from that of wild type (wt) RyR2. HEK293 cells expressing RyR2(S437-GFP) displayed a propensity for store overload-induced Ca(2+) release similar to that in cells expressing RyR2-wt. The three-dimensional structure of the purified RyR2(S437-GFP) was reconstructed using cryo-electron microscopy and single particle image processing. Subtraction of the three-dimensional reconstructions of RyR2-wt and RyR2(S437-GFP) revealed the location of the inserted GFP, and hence the NH(2)-terminal mutation hot spot, in a region between domains 5 and 9 in the clamp-shaped structure. This location is close to a previously mapped central disease-causing mutation site located in a region between domains 5 and 6. These results, together with findings from previous studies, suggest that the proposed interactions between the NH(2)-terminal and central regions of RyR2 are likely to take place between domains 5 and 6 and that the clamp-shaped structure, which shows substantial conformational differences between the closed and open states, is highly susceptible to disease-causing mutations.
Figures
Similar articles
-
Three-dimensional localization of divergent region 3 of the ryanodine receptor to the clamp-shaped structures adjacent to the FKBP binding sites.J Biol Chem. 2003 Apr 18;278(16):14211-8. doi: 10.1074/jbc.M213164200. Epub 2003 Feb 7. J Biol Chem. 2003. PMID: 12576471
-
Localization of PKA phosphorylation site, Ser(2030), in the three-dimensional structure of cardiac ryanodine receptor.Biochem J. 2008 Mar 1;410(2):261-70. doi: 10.1042/BJ20071257. Biochem J. 2008. PMID: 17967164 Free PMC article.
-
Location of divergent region 2 on the three-dimensional structure of cardiac muscle ryanodine receptor/calcium release channel.J Mol Biol. 2004 Apr 30;338(3):533-45. doi: 10.1016/j.jmb.2004.03.011. J Mol Biol. 2004. PMID: 15081811
-
Involvement of the cardiac ryanodine receptor/calcium release channel in catecholaminergic polymorphic ventricular tachycardia.J Cell Physiol. 2002 Jan;190(1):1-6. doi: 10.1002/jcp.10031. J Cell Physiol. 2002. PMID: 11807805 Review.
-
Ryanodine receptor mutations in arrhythmia: The continuing mystery of channel dysfunction.FEBS Lett. 2010 May 17;584(10):2153-60. doi: 10.1016/j.febslet.2010.01.057. Epub 2010 Feb 2. FEBS Lett. 2010. PMID: 20132818 Review.
Cited by
-
Subnanometer-resolution electron cryomicroscopy-based domain models for the cytoplasmic region of skeletal muscle RyR channel.Proc Natl Acad Sci U S A. 2008 Jul 15;105(28):9610-5. doi: 10.1073/pnas.0803189105. Epub 2008 Jul 10. Proc Natl Acad Sci U S A. 2008. PMID: 18621707 Free PMC article.
-
Dynamic, inter-subunit interactions between the N-terminal and central mutation regions of cardiac ryanodine receptor.J Cell Sci. 2010 May 15;123(Pt 10):1775-84. doi: 10.1242/jcs.064071. Epub 2010 Apr 27. J Cell Sci. 2010. PMID: 20427316 Free PMC article.
-
Ligand-dependent conformational changes in the clamp region of the cardiac ryanodine receptor.J Biol Chem. 2013 Feb 8;288(6):4066-75. doi: 10.1074/jbc.M112.427864. Epub 2012 Dec 20. J Biol Chem. 2013. PMID: 23258540 Free PMC article.
-
The RYR2-encoded ryanodine receptor/calcium release channel in patients diagnosed previously with either catecholaminergic polymorphic ventricular tachycardia or genotype negative, exercise-induced long QT syndrome: a comprehensive open reading frame mutational analysis.J Am Coll Cardiol. 2009 Nov 24;54(22):2065-74. doi: 10.1016/j.jacc.2009.08.022. J Am Coll Cardiol. 2009. PMID: 19926015 Free PMC article.
-
FRET-based localization of fluorescent protein insertions within the ryanodine receptor type 1.PLoS One. 2012;7(6):e38594. doi: 10.1371/journal.pone.0038594. Epub 2012 Jun 13. PLoS One. 2012. PMID: 22719904 Free PMC article.
References
-
- Scoote M, Williams AJ. Biochem. Biophys. Res. Commun. 2004;322:1286–1309. - PubMed
-
- Kontula K, Laitinen PJ, Lehtonen A, Toivonen L, Viitasalo M, Swan H. Cardiovasc. Res. 2005;67:379–387. - PubMed
-
- Yano M, Yamamoto T, Ikeda Y, Matsuzaki M. Nat. Clin. Pract. Cardiovasc. Med. 2006;3:43–52. - PubMed
-
- Loke J, MacLennan DH. Am. J. Med. 1998;104:470–486. - PubMed
Publication types
MeSH terms
Substances
Grants and funding
LinkOut - more resources
Full Text Sources
Other Literature Sources
Medical
Molecular Biology Databases
Miscellaneous
