. 2007 Jun 22;282(25):18379-18387.
doi: 10.1074/jbc.M610792200. Epub 2007 Apr 23.

Human tribbles-1 controls proliferation and chemotaxis of smooth muscle cells via MAPK signaling pathways

Affiliations

Human tribbles-1 controls proliferation and chemotaxis of smooth muscle cells via MAPK signaling pathways

Hye Youn Sung et al. J Biol Chem. .

Abstract

Migration and proliferation of smooth muscle cells are key to a number of physiological and pathological processes, including wound healing and the narrowing of the vessel wall. Previous work has shown links between inflammatory stimuli and vascular smooth muscle cell proliferation and migration through mitogen-activated protein kinase (MAPK) activation, although the molecular mechanisms of this process are poorly understood. Here we report that tribbles-1, a recently described modulator of MAPK activation, controls vascular smooth muscle cell proliferation and chemotaxis via the Jun kinase pathway. Our findings demonstrate that this regulation takes place via direct interactions between tribbles-1 and MKK4/SEK1, a Jun activator kinase. The activity of this kinase is dependent on tribbles-1 levels, whereas the activation and the expression of MKK4/SEK1 are not. In addition, tribbles-1 expression is elevated in human atherosclerotic arteries when compared with non-atherosclerotic controls, suggesting that this protein may play a role in disease in vivo. In summary, the data presented here suggest an important regulatory role for trb-1 in vascular smooth muscle cell biology.


Figures
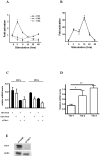
Figure 1
Figure 1
trb-1 expression in cultured human Aortic Smooth Muscle Cells. hASMC were stimulated by LPS for the various time points as indicated, total RNA was prepared and qRT-PCR was performed to detect changes in (A) tribbles 1-3 mRNA expression levels. (B) IL-1β levels were also measured as positive controls in the same samples. (C) The impact of culture conditions on Trb-1 expression was assessed in control and si-trb-1 transfected hASMC cells by qRT-PCR. (D) The specificity of si-trb-1 knockdown was evaluated by qRT-PCR, comparing expression levels of trb-1, -2 and -3 in si-trb-1 transfected cells. The values were normalised to the expression of tribbles in cells transfected with control siRNA. (E) The efficiency of si-trb-1 treatment was assessed by western blot. Cells were transfected with control or trb-1 specific siRNA and western blot was performed on whole cell lysates using an anti-trb-1 antibody.
Figure 2
Figure 2
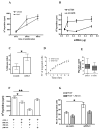
trb-1 function in hASMC proliferation, migration and chemotaxis. hASMC cells were transfected with a trb-1 overexpression construct (A) or si-trb1-1 siRNA (B). Proliferation rate was measured by 3H thymidine incorporation. As an independent measure of proliferation, time-lapse video microscopy was performed and the percentage of mitotic cells on each field were calculated (C). The number of cells migrated through the edge of the wound (D) and their speed of migration (E) was assessed in a wound-healing assay. (F) The effect of MAPK inhibitors on proliferation rate was measured as on panel B. (G) The number of cells migrated through the Boyden chamber in response to PDGF were compared between control and si-trb-1 transfected cells. In addition, the impact of JNK inhibitor on the migrating cells was also investigated. The impact of tribbles-1 knockdown on the expression of TNFα mRNA (H) and TGFβ protein levels (I) was evaluated by qRT-PCR and ELISA, respectively.
Figure 2
Figure 2
trb-1 function in hASMC proliferation, migration and chemotaxis. hASMC cells were transfected with a trb-1 overexpression construct (A) or si-trb1-1 siRNA (B). Proliferation rate was measured by 3H thymidine incorporation. As an independent measure of proliferation, time-lapse video microscopy was performed and the percentage of mitotic cells on each field were calculated (C). The number of cells migrated through the edge of the wound (D) and their speed of migration (E) was assessed in a wound-healing assay. (F) The effect of MAPK inhibitors on proliferation rate was measured as on panel B. (G) The number of cells migrated through the Boyden chamber in response to PDGF were compared between control and si-trb-1 transfected cells. In addition, the impact of JNK inhibitor on the migrating cells was also investigated. The impact of tribbles-1 knockdown on the expression of TNFα mRNA (H) and TGFβ protein levels (I) was evaluated by qRT-PCR and ELISA, respectively.
Figure 3
Figure 3
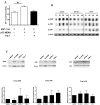
Overexpression and suppression of trb-1 expression modulates activation of MAPK. (A) hASMC cells were transfected with AP-1 luciferase reporter, activated by the co-expression of pFC MEKK1 (both Stratagene) in the presence and absence of overexpressed trb-1, as indicated. (B) cells were transfected with empty vector (mock), trb-1 overexpression construct or si-trb1-1 siRNA, stimulated with LPS for 0-45 minutes, as indicated on the figure, lysed and pMAPK and β-actin levels were determined by Western blotting. (C) Unstimulaed cell lysates (0 time point) were used to detect the impact of altered trb-1 levels on steady state MAPK expression by Western blotting for total MAPK and β-actin. The signal intensity was quantified as above and expressed as a total MAPK/β-actin ratio. MAPK/β-actin levels in the mock transfected cells were taken as baseline (1 unit) and values measured in the si-trb-1 and overexpressed samples were plotted relative to these.
Figure 4
Figure 4
MKK4 - trb-1 interaction controls hASMC proliferation. (A) Expression of MKK4 and MKK7 in hASMC and the impact of trb-1 knockdown on the protein levels of these MAPKKs were assessed by Western Blotting. (B) Activation of MKK4 (30 mins, 100ng/ml LPS) was evaluated under normal and reduced trb-1 levels. pMKK4 values were normalised to actin and expressed as a ratio. (C) The ability of MKK4 to control hASMC proliferation rate was measured as on Figure 2 (24hrs post-transfection). The efficiency of MKK4 knockdown was verified by western blot (Upper panel) (D) Physical interaction between MKK4 and trb-1 in hASMC was investigated by PCA. As positive controls, EGFP expression plasmid (left upper panel) and 'zipper-PCA' (left lower panel, zip-V1 and zip-V2) constructs were used. MKK4 was fused to the N-terminal fragment of Venus-YFP (V1), whilst trb-1 was expressed in fusion with the C-terminal fragment of Venus-YFP (V2). Representative cells show interaction between MKK4 and trb-1 (right panels). (E) To further confirm association between trb-1 and MKK4, co-immunoprecipitation was performed, using trb-1-myc expression construct. Lane 1: detection of MKK4 in a whole cell lysate. Lane 2: detection of MKK4 after anti-myc pull-down. (F) The impact of the N- and C-terminal domains of trb-1 on interaction with MKK4 in live cells and the location of the trb-1/MKK4 complex was assessed by PCA. (G) The structure of trb-1 mutants and the positions of the N- and C-terminal deletions is shown. (H) To confirm the specificity of MKK4/trb-1 interaction, FACS was used to demonstrate the specific interaction between trb-1 and MKK4 in HeLa cells. Similarly to figure 5E, an increasing dose of non-fluorescent trb-1 expression plasmid was co-transfected to compete out the labelled protein from the fluorescent complex. Further, no interaction was detected between control plasmids and either MKK4-V1 or trb-1-V2. (I) As a further control, an increasing dose of trb-1 expression plasmid (unlabelled) was co-transfected in HeLa cells with the above two constructs (left) and the average total fluorescence per cell was measured (right) by fluorescent microscopy.
Figure 4
Figure 4
MKK4 - trb-1 interaction controls hASMC proliferation. (A) Expression of MKK4 and MKK7 in hASMC and the impact of trb-1 knockdown on the protein levels of these MAPKKs were assessed by Western Blotting. (B) Activation of MKK4 (30 mins, 100ng/ml LPS) was evaluated under normal and reduced trb-1 levels. pMKK4 values were normalised to actin and expressed as a ratio. (C) The ability of MKK4 to control hASMC proliferation rate was measured as on Figure 2 (24hrs post-transfection). The efficiency of MKK4 knockdown was verified by western blot (Upper panel) (D) Physical interaction between MKK4 and trb-1 in hASMC was investigated by PCA. As positive controls, EGFP expression plasmid (left upper panel) and 'zipper-PCA' (left lower panel, zip-V1 and zip-V2) constructs were used. MKK4 was fused to the N-terminal fragment of Venus-YFP (V1), whilst trb-1 was expressed in fusion with the C-terminal fragment of Venus-YFP (V2). Representative cells show interaction between MKK4 and trb-1 (right panels). (E) To further confirm association between trb-1 and MKK4, co-immunoprecipitation was performed, using trb-1-myc expression construct. Lane 1: detection of MKK4 in a whole cell lysate. Lane 2: detection of MKK4 after anti-myc pull-down. (F) The impact of the N- and C-terminal domains of trb-1 on interaction with MKK4 in live cells and the location of the trb-1/MKK4 complex was assessed by PCA. (G) The structure of trb-1 mutants and the positions of the N- and C-terminal deletions is shown. (H) To confirm the specificity of MKK4/trb-1 interaction, FACS was used to demonstrate the specific interaction between trb-1 and MKK4 in HeLa cells. Similarly to figure 5E, an increasing dose of non-fluorescent trb-1 expression plasmid was co-transfected to compete out the labelled protein from the fluorescent complex. Further, no interaction was detected between control plasmids and either MKK4-V1 or trb-1-V2. (I) As a further control, an increasing dose of trb-1 expression plasmid (unlabelled) was co-transfected in HeLa cells with the above two constructs (left) and the average total fluorescence per cell was measured (right) by fluorescent microscopy.
Figure 5
Figure 5
trb-1 expression is up-regulated in IHD (A)Total RNA was prepared from sections of human coronary arteries from explanted hearts with IHD (n=8) (“Disease”) or DCM (n=6) (“Control”). qRT-PCR was performed to quantify expression levels of major inflammatory cytokines and tribbles 1-3. Expression data was normalised for GAPDH as housekeeping control. Statistical analysis was performed by PRISM, using Student's t-test. Relative expression values are presented using “box and whisker plots”. (B) Transverse sections of human coronary artery stained with trb-1 antibody. a) Haematoxylin and Eosin staining to show vessel architecture I intima, IEL, internal elastic lamina, M media; b) Trb-1 (brown staining) in intimal and medial areas, boxed area shown in d); c) control staining of a serial section with no primary trb-1 antibody; d) trb-1 staining to show individually stained VSMC (arrows).In a and b scale bar is 50μm; c and d scale bar is 25μm.
Figure 6
Figure 6
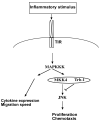
The role of trb-1 in VSMC biology

Similar articles

Cited by

References

    1. Ju H, Nerurkar S, Sauermelch CF, Olzinski AR, Mirabile R, Zimmerman D, Lee JC, Adams J, Sisko J, Berova M, Willette RN. J Pharmacol Exp Ther. 2002;301:15–20. - PubMed
    1. Surapisitchat J, Hoefen RJ, Pi X, Yoshizumi M, Yan C, Berk BC. Proc Natl Acad Sci U S A. 2001;98:6476–6481. - PMC - PubMed
    1. Takeishi Y, Huang Q, Wang T, Glassman M, Yoshizumi M, Baines CP, Lee JD, Kawakatsu H, Che W, Lerner-Marmarosh N, Zhang C, Yan C, Ohta S, Walsh RA, Berk BC, Abe J. J Mol Cell Cardiol. 2001;33:1989–2005. - PubMed
    1. Bonventre JV, Force T. Curr Opin Nephrol Hypertens. 1998;7:425–433. - PubMed
    1. Choukroun G, Hajjar R, Kyriakis JM, Bonventre JV, Rosenzweig A, Force T. J Clin Invest. 1998;102:1311–1320. - PMC - PubMed

Publication types

Substances