Comparative Study
. 2007 May 14;204(5):1119-30.
doi: 10.1084/jem.20061959. Epub 2007 Apr 23.

Mature natural killer cell and lymphoid tissue-inducing cell development requires Id2-mediated suppression of E protein activity

Affiliations
Comparative Study

Mature natural killer cell and lymphoid tissue-inducing cell development requires Id2-mediated suppression of E protein activity

Markus D Boos et al. J Exp Med. .

Abstract

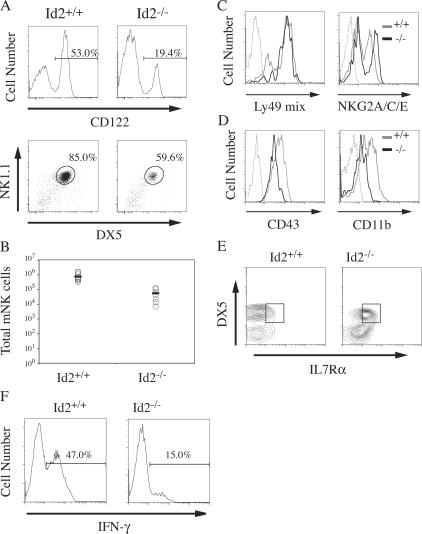
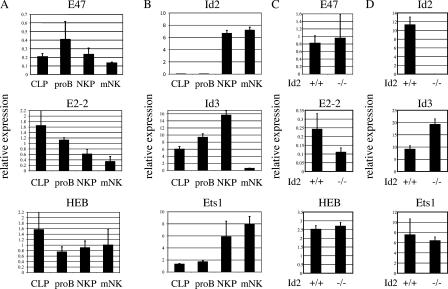
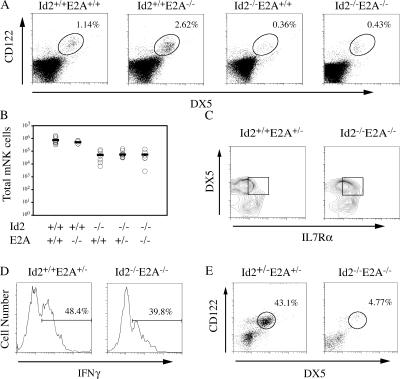
The Id2 transcriptional repressor is essential for development of natural killer (NK) cells, lymphoid tissue-inducing (LTi) cells, and secondary lymphoid tissues. Id2 was proposed to regulate NK and LTi lineage specification from multipotent progenitors through suppression of E proteins. We report that NK cell progenitors are not reduced in the bone marrow (BM) of Id2(-/-) mice, demonstrating that Id2 is not essential for NK lineage specification. Rather, Id2 is required for development of mature (m) NK cells. We define the mechanism by which Id2 functions by showing that a reduction in E protein activity, through deletion of E2A, overcomes the need for Id2 in development of BM mNK cells, LTi cells, and secondary lymphoid tissues. However, mNK cells are not restored in the blood or spleen of Id2(-/-)E2A(-/-) mice, suggesting a role for Id2 in suppression of alternative E proteins after maturation. Interestingly, the few splenic mNK cells in Id2(-/-) and Id2(-/-)E2A(-/-) mice have characteristics of thymus-derived NK cells, which develop in the absence of Id2, implying a differential requirement for Id2 in BM and thymic mNK development. Our findings redefine the essential functions of Id2 in lymphoid development and provide insight into the dynamic regulation of E and Id proteins during this process.


Figures

Figure 1.
Figure 1.
Decreased production of mNK cells, but not NKP, in BM of Id2−/− mice. (A) BM cells from Id2+/+ and Id2−/− mice were depleted of Lin+ cells and stained for CD122, NK1.1, and DX5. NK1.1 versus DX5 (bottom) expression on LinCD122+ cells (top) is shown. (B) Total number of mNK (NK1.1+DX5+) and NK1.1hiDX5hi cells in BM of Id2+/+ (n = 9) and Id2−/− (n = 12) mice (P < 0.002 for both). Each circle represents the number of cells in femoral BM from one mouse. Bars represent the mean number of NK cells. (C) Total number of NKP and iNK in Id2+/+ and Id2−/− BM (NKP, P = 0.4; iNK, P = 0.08). (D) NKG2D expression on LinCD122+ NK1.1DX5 BM NKPs from Id2+/+ (gray line) and Id2−/− (black line) mice. A negative Ig control (dashed line) is shown for comparison. (E) Thymocytes from Id2+/+ and Id2−/− mice were stained for Lin+ cells, CD122, DX5, and IL7Rα. DX5 versus IL7Rα on LinCD122+ cells is shown, with the gated population representing “thymic” mNK cells. Positive expression of DX5 and IL7Rα was determined in comparison with samples stained with isotype control antibody. (F) Total number of DX5+ mNK in the thymus of Id2+/+ (n = 9) and Id2−/− (n = 9) mice (P = 0.7). Each circle represents the number of cells in one mouse. Bars represent the mean number of NK cells. Mice used in A–C were mixed FVB/NJ × 129/SvJ, and mice used for D and E were backcrossed onto 129/SvJ more than eight times.
Figure 2.
Figure 2.
Splenic mNK cells in Id2−/− mice are reduced in number and resemble thymic mNK cells. (A) Splenocytes were stained for Lin+ cells, CD122, NK1.1, and DX5. NK1.1 versus DX5 (bottom) on LinCD122+ cells (top) is shown. (B) Total number of LinCD122+DX5+ mNK cells in spleen of Id2+/+ (n = 10) and Id2−/− mice (n = 7; P < 0.002). Each circle represents the number of cells in one spleen. Bars represent the mean number of NK cells. Ly49 receptor (detected with a mix of anti-Ly49 antibodies) and NKG2A/C/E (C) or CD43 and CD11b (D) expression on LinCD122+DX5+ cells from Id2+/+ (gray line) and Id2−/− (black line) splenocytes. Isotype control antibody (dashed line) is shown. Between three and eight mice were analyzed for each marker. (E) IL7Rα and DX5 expression on LinCD122+ splenocytes from Id2+/+ and Id2−/− mice. The boxed area represents IL7Rα+DX5+ cells based on isotype control staining of the same population and is representative of six independent experiments. (F) Lineage-depleted splenocytes from Id2+/+ and Id2−/− mice were cultured for 12 h with IL-2 and IL-12. Intracellular IFNγ expression in CD3DX5+ cells is shown. Mice used in A and B were mixed FVB/NJ × 129/SvJ, and mice used in C–F were backcrossed more than eight times.
Figure 3.
Figure 3.
E protein and Id gene expression in NK cell subsets. QPCR analysis of E47, E2-2, and HEB (A) and Id2, Id3, and Ets1 (B) in CLPs, pro-B lymphocytes (proB), and NKP, and mNK cells isolated from BM of C57Bl/6 mice. Similar results were observed using NKP and mNK from FVB/NJ × 129/SvJ mice. QPCR analysis of E47, E2-2, and HEB (C) and Id2, Id3, and Ets1 (D) in Id2+/+ and Id2−/− BM NKPs (mixed FVB/NJ × 129/SvJ). E47, HEB, E2-2, and Ets1 ΔCT values are normalized to the level of expression in 38B9 pro-B lymphocytes (set to 1). Id2 ΔCT values are normalized to PTL, and Id3 ΔCT values are normalized to 70Z/3 m/2C1 cells. All samples were run in triplicate, and the standard error is indicated. Experiment is representative of at least three independent amplifications.
Figure 4.
Figure 4.
Mature NK cell development is restored in the BM of Id2−/−E2A−/− mice. (A) Lin BM cells from mice of the indicated genotype were analyzed for the presence of CD122+DX5+ mNK cells via flow cytometry. (B) Total number of BM mNK cells for mice of the indicated genotype. Each circle represents the number of femoral mNK cells in one mouse, and bars represent the mean number of mNK cells. Id2+/+E2A+/+, n = 13; Id2+/+E2A−/−, n = 7; Id2−/−E2A+/+, n = 6; Id2/E2A+/−, n = 10; Id2−/−E2A−/−, n = 7. Id2+/+E2A+/+ versus Id2−/−E2A−/−, P = 0.05; Id2−/−E2A+/+ versus Id2−/−E2A−/−, P < 0.05. Ly49 receptor, CD94, and NKG2A/C/E (C) or CD43 and CD11b (D) expression on LinCD122+DX5+ BM cells from Id2−/−E2A−/− (black line) and littermate control (Id2+/+ E2A+/− or Id2+/−E2A+/−; gray line) mice. Data is representative of two to six mice analyzed. (E) Lineage-depleted BM cells from Id2−/−E2A−/− and Id2+/+E2A+/− mice were cultured for 12 h with IL-2 and IL-12. Intracellular IFNγ expression in CD3DX5+ cells is shown. All mice were mixed FVB/NJ × 129/SvJ.
Figure 5.
Figure 5.
Loss of E2A does not rescue the phenotype of mNK cells in Id2−/− spleen. (A) FACS analysis for CD122 and DX5 on Lin splenocytes from mice with the indicated genotype. (B) Total number of Lin mNK cells in the spleen of mice with the indicated genotype. Each circle represents the number of mNK cells in one spleen, and bars represent the mean number of mNK cells. Id2+/+E2A+/+, n = 13; Id2+/+E2A−/−, n = 7; Id2−/−E2A+/+, n = 6; Id2−/−E2A+/−, n = 10; Id2−/−E2A−/−, n = 7. (C) DX5 and IL7Rα expression on LinCD122+ splenocytes from Id2+/+ E2A+/− and Id2−/−E2A−/− mice. Data is representative of at least three mice of each genotype. (D) Lin-depleted splenocytes from Id2−/−E2A−/− and Id2+/+E2A+/− mice were cultured for 12 h with IL-2 and IL-12. Intracellular IFNγ expression in CD3DX5+ cells is shown. (E) CD122 and DX5 expression on Lin peripheral blood from Id2−/−E2A−/− and Id2+/−E2A+/− mice. Data is representative of four separate experiments. All mice were mixed FVB/NJ × 129/SvJ.
Figure 6.
Figure 6.
Development of LNs, PPs, and LTi cells in Id2−/−E2A−/− mice. (A) Inguinal LNs from Id2+/−E2A+/+, Id2−/−E2A+/+, Id2−/−E2A+/−, and Id2−/−E2A−/− mice were examined 2 wk after injection of Chicago sky blue. Bar, 0.5 cm. (B) Intestinal PPs were examined in Id2+/+E2A+/+, Id2−/−E2A+/+, Id2−/−E2A+/−, and Id2−/−E2A−/− mice after treatment with acetic acid. Bar, 0.5 cm. (C and D) Cryosections of fixed embryonic day 15.5 embryos were stained with antibodies detecting LTi cells or stromal “organizer” cells. (C) CD4 (red) and VCAM-1 (green) in the cervical region of the embryo and CD45 (D, green) and ICAM-1 (red) in the omentum. All mice were mixed FVB/NJ × 129/SvJ. Bars, 100 μm.

Similar articles

Cited by

References

    1. Yokoyama, W.M., S. Kim, and A.R. French. 2004. They dynamic life of natural killer cells. Annu. Rev. Immunol. 22:405–429. - PubMed
    1. Vidal, S.M., and L.L. Lanier. 2006. NK cell recognition of mouse cytomegalovirus-infected cells. Curr. Top. Microbiol. Immunol. 298:183–206. - PubMed
    1. Stewart, C.A., E. Vivier, and M. Colonna. 2006. Strategies of natural killer cell recognition and signaling. Curr. Top. Microbiol. Immunol. 298:1–21. - PubMed
    1. McNerney, M.E., and V. Kumar. 2006. The CD2 family of natural killer cell receptors. Curr. Top. Microbiol. Immunol. 298:91–120. - PubMed
    1. Kondo, M., I.L. Weissman, and K. Akashi. 1997. Identification of clonogenic common lymphoid progenitors in mouse bone marrow. Cell. 91:661–672. - PubMed

Publication types

MeSH terms

Substances