. 2007 Apr 23;177(2):355-67.
doi: 10.1083/jcb.200611011.

PtdIns(4,5)P2 turnover is required for multiple stages during clathrin- and actin-dependent endocytic internalization

Affiliations

PtdIns(4,5)P2 turnover is required for multiple stages during clathrin- and actin-dependent endocytic internalization

Yidi Sun et al. J Cell Biol. .

Abstract

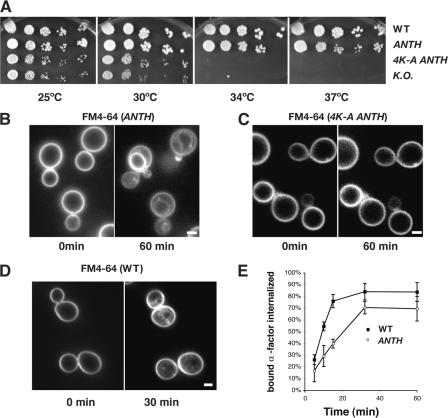
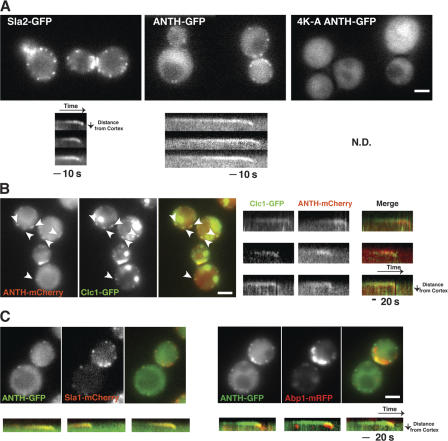
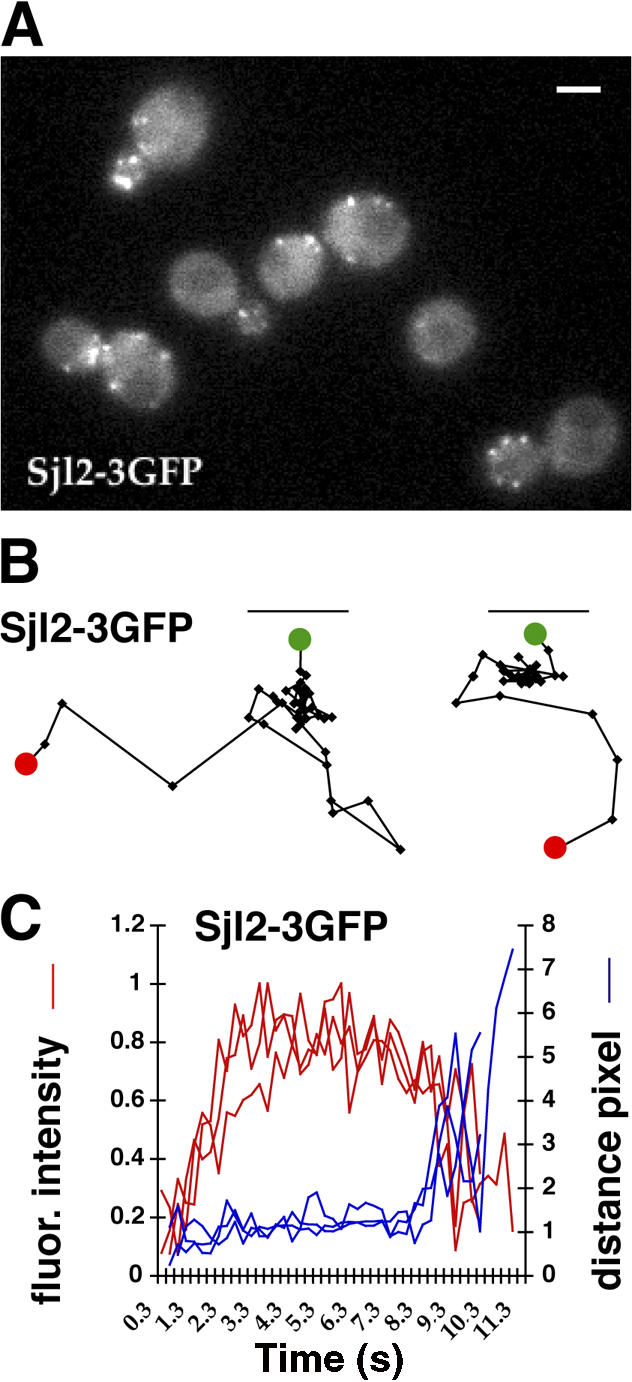
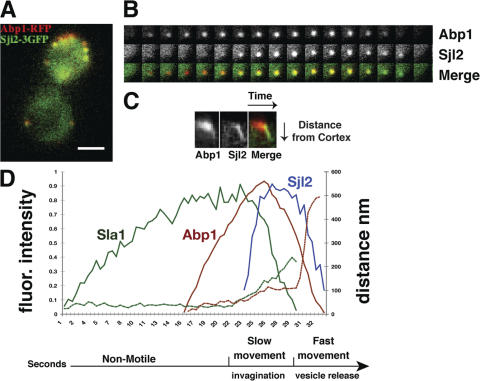
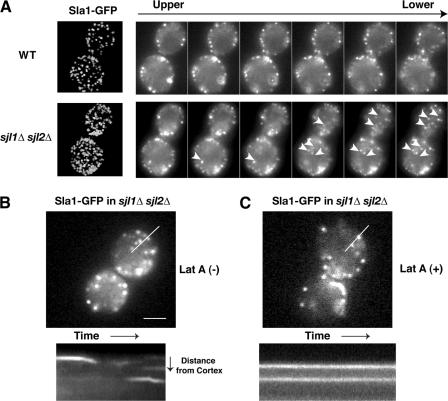
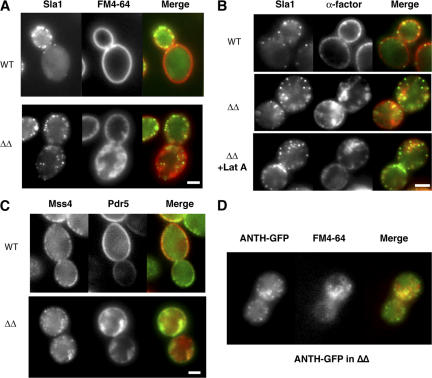
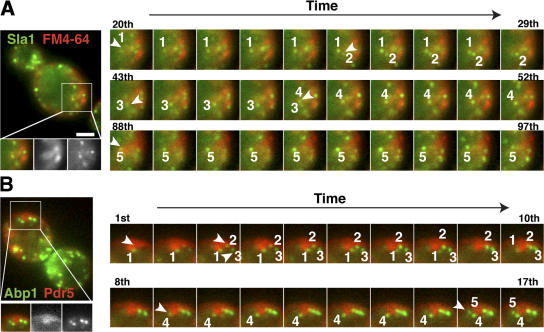
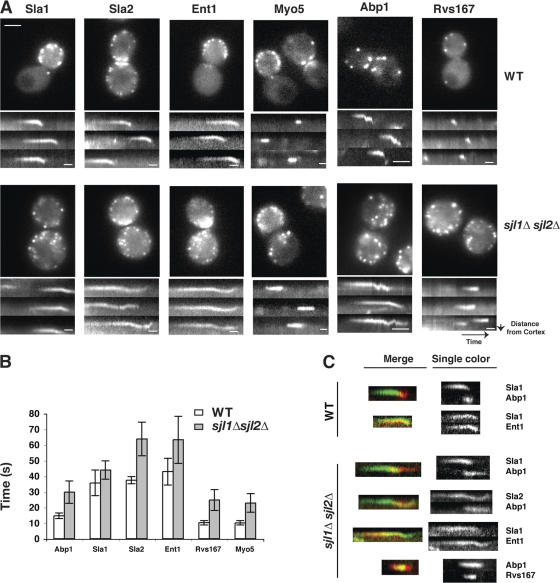
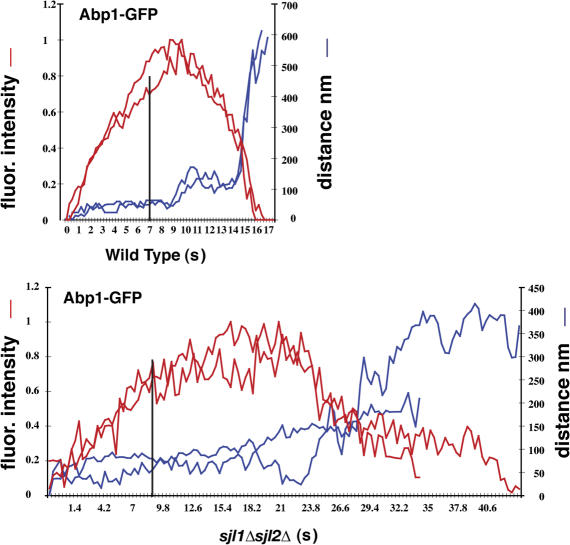
The lipid phosphatidylinositol-4,5-bisphosphate (PtdIns[4,5]P(2)) appears to play an important role in endocytosis. However, the timing of its formation and turnover, and its specific functions at different stages during endocytic internalization, have not been established. In this study, Sla2 ANTH-GFP and Sjl2-3GFP were expressed as functional fusion proteins at endogenous levels to quantitatively explore PtdIns(4,5)P(2) dynamics during endocytosis in yeast. Our results indicate that PtdIns(4,5)P(2) levels increase and decline in conjunction with coat and actin assembly and disassembly, respectively. Live-cell image analysis of endocytic protein dynamics in an sjl1Delta sjl2Delta mutant, which has elevated PtdIns(4,5)P(2) levels, revealed that the endocytic machinery is still able to assemble and disassemble dynamically, albeit nonproductively. The defects in the dynamic behavior of the various endocytic proteins in this double mutant suggest that PtdIns(4,5)P(2) turnover is required for multiple stages during endocytic vesicle formation. Furthermore, our results indicate that PtdIns(4,5)P(2) turnover may act in coordination with the Ark1/Prk1 protein kinases in stimulating disassembly of the endocytic machinery.


Figures

Figure 1.
Figure 1.
Sla2 ANTH-GFP is at least partially functional in endocytic internalization. (A) Growth of sla2 mutants. Strains were grown on YPD plates at the indicated temperatures. (B–D) FM4-64 uptake assay. Cells were treated with media containing FM4-64 in a flow chamber. FM4-64 was visualized by fluorescence microscopy every 10 min. Pictures were taken at 0 and 30 or 60 min (E) Receptor-mediated internalization of [35S]methionine-labeled α-factor in wild-type cells and sla2ANTH-GFP mutants after a 5-min preincubation at 25°C. Error bars represent the SD from three experiments. Bars, 2 μm.
Figure 2.
Figure 2.
Sla2 ANTH-GFP dynamics at endocytic sites. (A) Single frames from videos of live cells expressing different GFP-tagged proteins (top). Kymographs of single patches from videos of cells expressing the indicated GFP-tagged protein (1 frame/s; bottom). (B) Simultaneous localization of Clc1-GFP and Sla2-ANTH-mCherry in live cells. Kymographs of individual patches from 2-color videos of cells expressing Clc1-GFP and Sla2-ANTH-mCherry. (C) Simultaneous localization of GFP- and RFP-tagged proteins in live cells (top). Kymographs of individual patches from 2-color videos of cells expressing Sla2-ANTH-GFP and Sla1-mCherry, or Sla2-ANTH-GFP and Abp1-RFP (bottom). Bars, 2 μm.
Figure 3.
Figure 3.
Sjl2-3GFP dynamics at endocytic sites. (A) Single frame from a video of live cells expressing 3GFP-tagged Sjl2p. Bar, 2 μm. (B) Tracking of individual Sjl2-3GFP patches. Positions of the centers of patches were determined in each frame of a video from a medial focal plane of a cell, and consecutive positions were connected by lines. Green and red dots denote the first and last positions, respectively, of each patch. Patch traces are oriented so that the cell surface is up and the cell interior is down. The time difference between each position along the track is 0.25 s. (C) Quantitation of fluorescence intensity and distance from the site of patch formation for Sjl2-3GFP–labeled patches as a function of time. Each curve represents data from one patch. Fluorescence intensity over time was corrected for photobleaching.
Figure 4.
Figure 4.
Sjl2 dynamics during endocytic internalization. (A) Single frame from video of yeast expressing Abp1-RFP (red) and Sjl2-3GFP (green). Bar, 2 μm. (B) Single-channel or merged image montages of single patches from two-color videos of cells expressing Abp1-RFP and Sjl2-3GFP. (C) Kymograph representation of Abp1-RFP and Sjl2-3GFP in a single patch over time. (D) Alignment of averaged patch intensity measurements of endocytic proteins. The data from at least three patches were averaged using one-color videos of GFP-tagged endocytic proteins. Data for Sla1p and Abp1p were aligned by time separating intensity peaks in two-color videos (Kaksonen et al., 2003). Abp1p and Sjl2p were aligned in reference to the time when the fast movement starts.
Figure 5.
Figure 5.
Sla1-GFP localization in sjl1Δsjl2Δ cells. (A) Maximum intensity projection of z stacks for wild-type and sjl1Δ sjl2Δ cells expressing Sla1-GFP (left). Fluorescence intensity over time was corrected for photobleaching. Selected frames of z stack section around medial focal plane (right). Z axis interval is 300 nm. Arrows indicate the patches inside the cell. (B and C) sjl1Δ sjl2Δ cells expressing Sla1-GFP, and kymograph representation of Sla1-GFP patches on cortex and inside of the cell over time in the presence or absence of lat A. Bars, 2 μm.
Figure 6.
Figure 6.
Sla1p patches in the abnormal, deep membrane invaginations observed in the sjl1Δsjl2Δ mutant. (A) FM4-64 labeling of wild-type or sjl1Δ sjl2Δ cells expressing Sla1-GFP. FM4-64 and Sla1GFP were visualized immediately after FM4-64 was added to the media in a flow chamber. (B) Alexa Fluor 594–α-factor labeling of wild-type or sjl1Δ sjl2Δ cells expressing Sla1-GFP. Alexa Fluor 594–α-factor and Sla1p were visualized immediately after internalization was initiated in the presence or absence of lat A. (C) Wild-type or sjl1Δ sjl2Δ cells expressing Mss4-GFP and Pdr5-RFP. (D) FM4-64 labeling of sjl1Δ sjl2Δ cells expressing Sla2 ANTH-GFP. FM4-64 and Sla2 ANTH-GFP were visualized immediately after FM4-64 was added to the media in a flow chamber. Bars, 2 μm.
Figure 7.
Figure 7.
Sla1 patch dynamics in the abnormal, deep membrane invaginations of sjl1Δsjl2Δ mutants. (A) FM4-64 labeling over time of sjl1Δ sjl2Δ cells expressing Sla1-GFP. Single image from two-color video (left). FM4-64 is red, and Sla1-GFP is green. Selected frames show Sla1 patch dynamics at one deep, abnormal membrane invagination structure over time (right). The time to acquire one image pair was 2.8 s. The numbers in black indicate the frame number of the video. The numbers in white indicate different patches. (B) Two-color imaging of sjl1Δ sjl2Δ cells expressing Abp1-GFP and Pdr5-RFP. Selected frames show Abp1 patch dynamics at one deep, abnormal membrane invagination structure over time (right). Time to acquire one image pair was 2.8 s. The numbers in black indicate the frame number of the video and the numbers in white indicate different patches. Bar, 2 μm.
Figure 8.
Figure 8.
Different endocytic modules have distinct defects in sjl1Δsjl2Δ mutant. (A) Single frames from videos of wild-type or sjl1Δ sjl2Δ cells expressing different GFP-tagged endocytic proteins (first and third column). Bars, 2 μm. Kymographs of single patches from videos of cells expressing the indicated GFP-tagged protein (second and fourth columns). Scale bars for kymographs are 10 s. (B) Lifetimes for different patch proteins ± standard deviation. n = 30 patches for each strain. White bars indicate wild-type cells and gray bars indicate sjl1Δ sjl2Δ cells. (C) Kymographs of single patches from two-color videos of cells expressing the indicated GFP- and RFP-tagged proteins.
Figure 9.
Figure 9.
Dynamic Abp1 behavior in sjl1Δsjl2Δ cells. Quantitation of fluorescence intensity and distance from the site of patch formation for Abp1-GFP–labeled patches as a function of time in wild-type cells and sjl1Δ sjl2Δ cells. Each curve represents data from one patch. Fluorescence intensity over time was corrected for photobleaching. The vertical black line indicates the time point when Abp1-GFP reaches 80% of the peak intensity.

Similar articles

Cited by

References

    1. Aguilar, R.C., H.A. Watson, and B. Wendland. 2003. The yeast Epsin Ent1 is recruited to membranes through multiple independent interactions. J. Biol. Chem. 278:10737–10743. - PubMed
    1. Bairstow, S.F., K. Ling, X. Su, A.J. Firestone, C. Carbonara, and R.A. Anderson. 2006. Type Igamma661 phosphatidylinositol phosphate kinase directly interacts with AP2 and regulates endocytosis. J. Biol. Chem. 281:20632–20642. - PubMed
    1. Carlton, J.G., and P.J. Cullen. 2005. Coincidence detection in phosphoinositide signaling. Trends Cell Biol. 15:540–547. - PMC - PubMed
    1. Cope, M.J., S. Yang, C. Shang, and D.G. Drubin. 1999. Novel protein kinases Ark1p and Prk1p associate with and regulate the cortical actin cytoskeleton in budding yeast. J. Cell Biol. 144:1203–1218. - PMC - PubMed
    1. Cremona, O., G. Di Paolo, M.R. Wenk, A. Luthi, W.T. Kim, K. Takei, L. Daniell, Y. Nemoto, S.B. Shears, R.A. Flavell, et al. 1999. Essential role of phosphoinositide metabolism in synaptic vesicle recycling. Cell. 99:179–188. - PubMed

Publication types

MeSH terms