. 2007 May 1;104(18):7717-22.
doi: 10.1073/pnas.0609122104. Epub 2007 Apr 23.

Synchronous cycles of domestic dog rabies in sub-Saharan Africa and the impact of control efforts

Affiliations

Synchronous cycles of domestic dog rabies in sub-Saharan Africa and the impact of control efforts

Katie Hampson et al. Proc Natl Acad Sci U S A. .

Abstract

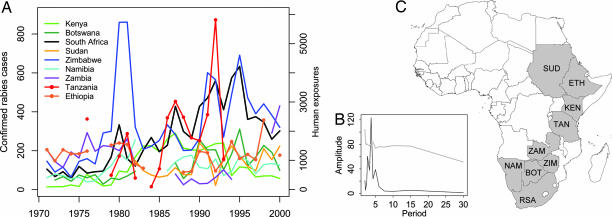
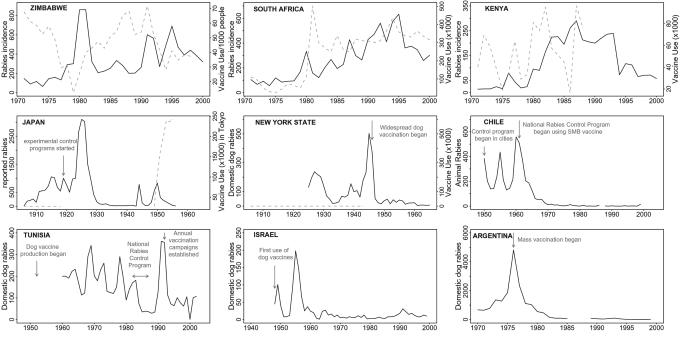
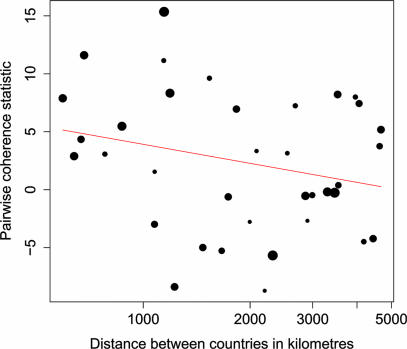
Rabies is a fatal neurological pathogen that is a persistent problem throughout the developing world where it is spread primarily by domestic dogs. Although the disease has been extensively studied in wildlife populations in Europe and North America, the dynamics of rabies in domestic dog populations has been almost entirely neglected. Here, we demonstrate that rabies epidemics in southern and eastern Africa cycle with a period of 3-6 years and show significant synchrony across the region. The observed period is shorter than predictions based on epidemiological parameters for rabies in domestic dogs. We find evidence that rabies prevention measures, including vaccination, are affected by disease prevalence and show that a simple model with intervention responses can capture observed disease periodicity and host dynamics. We suggest that movement of infectious or latent animals combined with coordinated control responses may be important in coupling populations and generating synchrony at the continental scale. These findings have important implications for rabies prediction and control: large-scale synchrony and the importance of intervention responses suggest that control of canine rabies in Africa will require sustained efforts coordinated across political boundaries.


Conflict of interest statement

The authors declare no conflict of interest.

Figures

Fig. 1.
Fig. 1.
Trends in rabies incidence from 1971 to 2000 across southern and eastern Africa. (A) Annual number of laboratory-confirmed rabies cases for each country, apart from Tanzania, where the annual number of people reporting to a hospital for postexposure treatment is shown. Initial inspection suggests 3- to 6-year periodicity and noisy synchrony of rabies epidemics. (B) A periodogram of the combined differenced data from each country with the 97.5th percentile of the spectra of the randomized data shown by a gray solid line illustrates the significant overall 3- to 6-year periodicity. (C) The location of countries included in the analysis. BOT, Botswana; KEN, Kenya; NAM, Namibia; RSA, South Africa; SUD, Sudan; ZIM, Zimbabwe; TAN, Tanzania; ETH, Ethiopia; ZAM, Zambia.
Fig. 2.
Fig. 2.
Model output showing the influence of reactive vaccination on the dynamics of rabies and domestic dog populations. Overall population density (black) and densities of susceptible (gray) and infected rabid animals (red) are shown (note the different scales). (A) In the absence of vaccination interventions, the overall population density is indistinguishable from the density of susceptibles, which initially show large damped oscillations during rabies outbreaks. (B) In the presence of reactive vaccination, short sustained oscillations in rabies incidence (on the order of every 4–5 years) are observed and overall dog population sizes remain approximately constant, although detectable cycling of susceptibles occurs. A response ratio (τ) of 70 vaccinations per rabies case detected is modeled with a dynamical delay of 8 months. (C) The effect of the magnitude of the delayed vaccination response to reported levels of rabies incidence on the cycle period (in years) is shown. These results are robust over a reasonable range of uncertainty for parameter estimates (sensitivity analyses are shown in SI Fig. 6).
Fig. 3.
Fig. 3.
Evidence for density-dependent feedbacks between rabies incidence and vaccination responses and the impacts of reactive and proactive vaccination campaigns. Rabies cases (solid black lines) and vaccine use (dotted gray lines) are plotted for Zimbabwe, South Africa, Kenya, Japan, New York, Chile, Tunisia, Israel, and Argentina (from refs. , , , and –44). Annotated arrows indicate initiation or changes in vaccination programs. For Zimbabwe, the number of dog vaccinations delivered per 1,000 people is shown, whereas for South Africa, Kenya, and Japan, the total number of vaccines used is plotted. Across Africa, domestic dog populations have been increasing; thus vaccine use would need to increase to maintain the same coverage. The Zimbabwe data therefore provide a better approximation of vaccination coverage, although the human/dog ratio is unlikely to have remained constant over this period. Large rabies outbreaks tend to follow periods with little vaccination use, and vaccine use tends to increase after large outbreaks (rabies incidence predicts 60% of the variation in vaccine use the following year for South Africa, and vaccine use predicts 40% of the variation in incidence the following year for both Zimbabwe and South Africa; P < 0.001 in all cases). Sustained mass vaccination results in declines in domestic dog rabies as shown by the records from Japan, New York, Chile, Israel, and Argentina. There is no evidence of short cycles in Japan, New York, or Argentina before vaccines were deployed. Approximately 5-year cycles occur in Chile, Tunisia, and Israel when vaccination efforts were not uniformly applied at a national level, whereas intensification of mass vaccination controlled dog rabies.
Fig. 4.
Fig. 4.
Relationship between geographic distance and phase synchrony. The pairwise correlation statistic (positive values indicate phase synchrony) is plotted against the log of the pairwise distance between countries. Distance is measured in kilometers. The red line is the weighted regression (using the square root of the number of points in the time series) of the correlation statistic against the log distance between countries (P = 0.072).

References

    1. Knobel DL, Cleaveland S, Coleman PG, Fevre EM, Meltzer MI, Miranda MEG, Shaw A, Zinsstag J, Meslin FX. Bull WHO. 2005;83:360–368. - PMC - PubMed
    1. WHO. World Survey of Rabies for 1998. Geneva: WHO; 1999.
    1. Kayali U, Mindekem R, Hutton G, Ndoutamia AG, Zinsstag J. Trop Med Int Health. 2006;11:1058–1065. - PubMed
    1. Coleman PG, Dye C. Vaccine. 1996;14:185–186. - PubMed
    1. Cleaveland S, Kaare M, Knobel D, Laurenson MK. Vet Microbiol. 2006;117:43–50. - PubMed

Publication types