. 2007 May;63(Pt 5):597-610.
doi: 10.1107/S0907444907009791. Epub 2007 Apr 21.

Interpretation of ensembles created by multiple iterative rebuilding of macromolecular models

Affiliations

Interpretation of ensembles created by multiple iterative rebuilding of macromolecular models

Thomas C Terwilliger et al. Acta Crystallogr D Biol Crystallogr. 2007 May.

Abstract

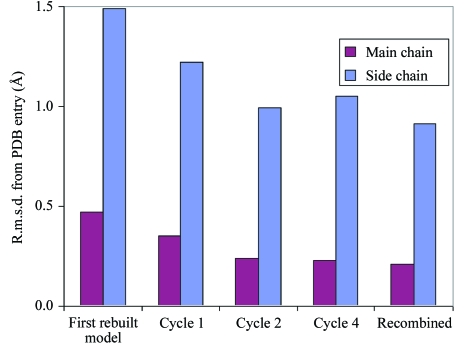
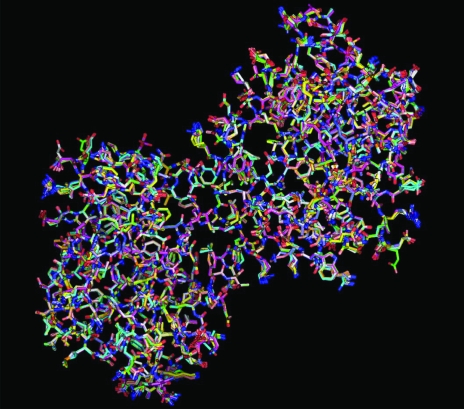
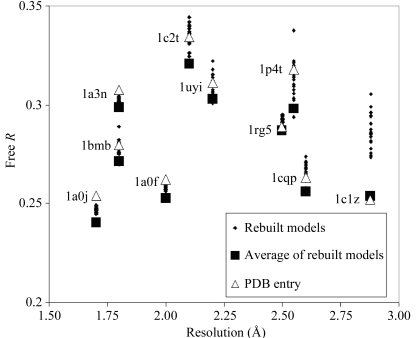
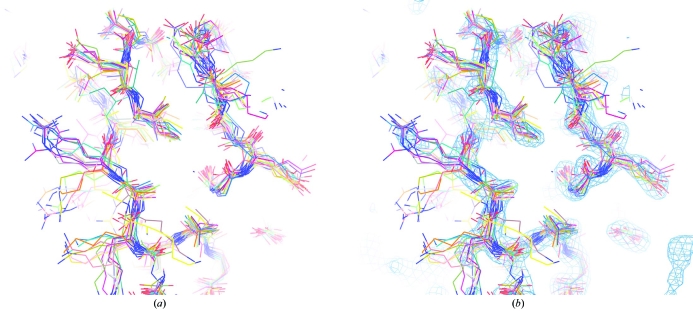
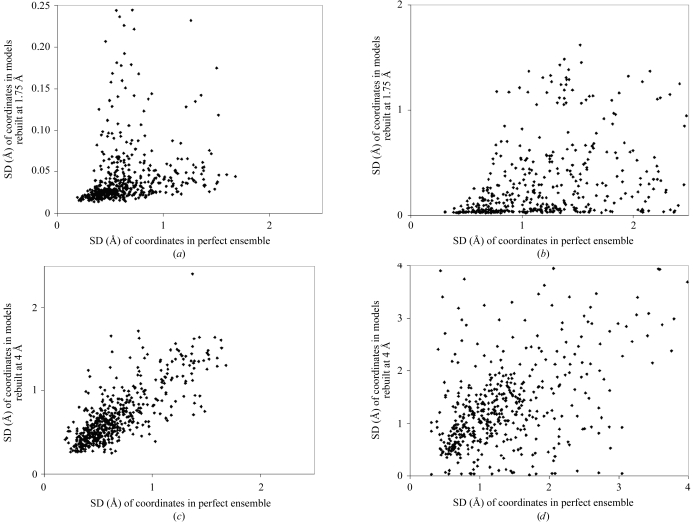
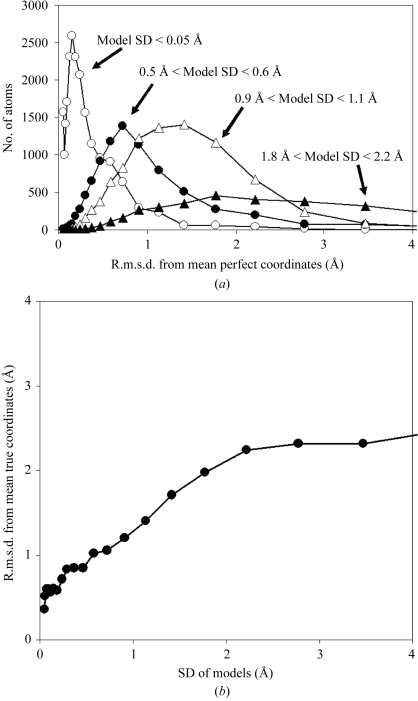
Automation of iterative model building, density modification and refinement in macromolecular crystallography has made it feasible to carry out this entire process multiple times. By using different random seeds in the process, a number of different models compatible with experimental data can be created. Sets of models were generated in this way using real data for ten protein structures from the Protein Data Bank and using synthetic data generated at various resolutions. Most of the heterogeneity among models produced in this way is in the side chains and loops on the protein surface. Possible interpretations of the variation among models created by repetitive rebuilding were investigated. Synthetic data were created in which a crystal structure was modelled as the average of a set of ;perfect' structures and the range of models obtained by rebuilding a single starting model was examined. The standard deviations of coordinates in models obtained by repetitive rebuilding at high resolution are small, while those obtained for the same synthetic crystal structure at low resolution are large, so that the diversity within a group of models cannot generally be a quantitative reflection of the actual structures in a crystal. Instead, the group of structures obtained by repetitive rebuilding reflects the precision of the models, and the standard deviation of coordinates of these structures is a lower bound estimate of the uncertainty in coordinates of the individual models.


Figures

Figure 1
Figure 1
Progress of model rebuilding for 1cqp. The r.m.s.d.s of refined models from the deposited coordinates of 1cqp are plotted for the first, second and fourth cycles of iterative model rebuilding, density modification and refinement and after the final recombination of five models to produce one of the 20 models of 1cqp.
Figure 2
Figure 2
PyMOL view (DeLano, 2002 ▶) of the overlay of 20 models of 1cqp obtained by repetitive model rebuilding, density modification and refinement.
Figure 3
Figure 3
Free R factors for rebuilt models, re-refined original models and composites of rebuilt models. Free R factors for each of the 20 rebuilt models for each structure from the PDB are illustrated as small diamonds. The free R factor for the original PDB entry, after refinement without solvent or ligands, is indicated by a large open triangle. The free R factor of a composite model corresponding to simple averaging of density from the 20 rebuilt models (including an implicit solvent model obtained as part of the refinement process) and calculated by simple averaging of complex structure factors based on all the component structures is indicated by a large filled square.
Figure 4
Figure 4
Models used to create synthetic ‘crystal’. (a) PyMOL view (DeLano, 2002 ▶) of 20 ‘perfect’ models in the ensemble used to create a synthetic data set. (b) Perfect models and perfect electron density corresponding to those models.
Figure 5
Figure 5
SD of coordinates of rebuilt models (precision) compared with SD of coordinates of perfect models used to create synthetic crystal. (a) Main-chain atoms of models rebuilt at a resolution of 1.75 Å. (b) Side-chain atoms of models rebuilt at a resolution of 1.75 Å. (c) Main-chain atoms of models rebuilt at a resolution of 4.0 Å. (d) Side-chain atoms of models rebuilt at a resolution of 4.0 Å.
Figure 6
Figure 6
SD of coordinates of rebuilt models (precision) compared with r.m.s.d. between rebuilt models and mean perfect structure (a rough measure of accuracy) in a synthetic data set. (a) Histograms of the number of atoms in models rebuilt at all resolutions (Table 3 ▶) with each value of r.m.s.d. from the mean true structure, grouped according to the SD of coordinates of rebuilt models. Open circles, atoms with SD of coordinates of rebuilt models of <0.05 Å; solid circles, 0.5 Å < SD < 0.6 Å; open triangles, 0.9 Å < SD < 1.1 Å; closed triangles, 1.8 Å < SD < 2.2 Å. (b) R.m.s.d. from mean true structure as a function of the SD of coordinates of rebuilt models. Atoms are grouped in bins as a function of the SD of coordinates of the rebuilt models and the mean r.m.s.d. from the mean true structure for each group is shown.
Figure 7
Figure 7
SD of coordinates of rebuilt models (precision) estimated using ensembles with different starting models in a synthetic data set. The ordinates are the SD of coordinates in the single ensemble obtained by rebuilding at a resolution of 1.75 Å listed in Table 3 ▶. The abscissas are the SD of the coordinates of the corresponding atoms in the six ensembles (1–6) in Table 4 ▶, rebuilt at the same resolution but using different starting models. (a) Main-chain atoms. (b) Side-chain atoms.
Figure 8
Figure 8
Comparison of free R values of models built at varying resolutions with models built at a resolution of 1.75 Å. The open diamonds indicate the mean of the free R values of the models built at varying resolutions as described in Table 3 ▶. The closed diamonds show the mean of the free R values of the models built at a resolution of 1.75 Å, but only using data to the indicated resolutions to calculate the free R values. The error bars are ±1 SD. The open circles indicate the free R value of composite models constructed as described in the text from the ensemble of models built at varying resolutions.

References

    1. Adams, P. D., Grosse-Kunstleve, R. W., Hung, L.-W., Ioerger, T. R., McCoy, A. J., Moriarty, N. W., Read, R. J., Sacchettini, J. C., Sauter, N. K. & Terwilliger, T. C. (2002). Acta Cryst. D58, 1948–1954. - PubMed
    1. Afonine, P. V., Grosse-Kunstleve, R. W. & Adams, P. D. (2005a). Acta Cryst. D61, 850–855. - PMC - PubMed
    1. Afonine, P. V., Grosse-Kunstleve, R. W. & Adams, P. D. (2005b). CCP4 Newsl.42, contribution 8.
    1. Bakker, P. I. de, Furnham, N., Blundell, T. L. & DePristo, M. A. (2006). Curr. Opin. Struct. Biol.16, 160–165. - PubMed
    1. Berman, H. M., Westbrook, J., Feng, Z., Gilliland, G., Bhat, T. N., Wiessig, I. N., Shindyalov, I. N. & Bourne, P. E. (2000). Nucleic Acids Res.28, 235–242. - PMC - PubMed

Publication types

Substances

LinkOut - more resources