. 2007 Jun;8(2):294-304.
doi: 10.1007/s10162-007-0073-z. Epub 2007 Feb 14.

Visually-guided attention enhances target identification in a complex auditory scene

Affiliations

Visually-guided attention enhances target identification in a complex auditory scene

Virginia Best et al. J Assoc Res Otolaryngol. 2007 Jun.

Abstract

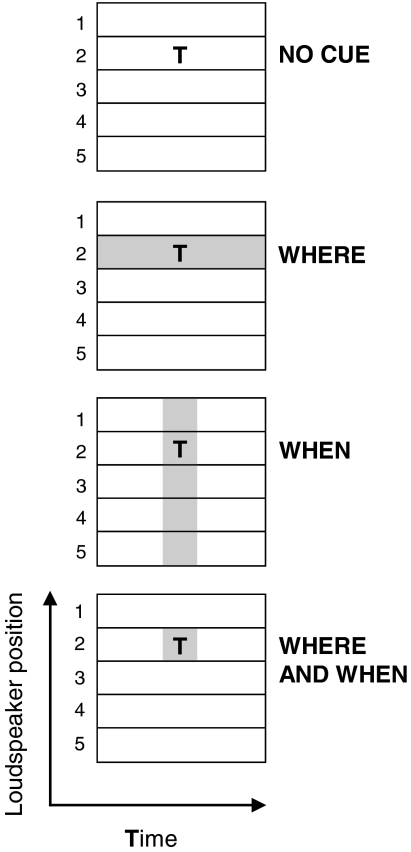
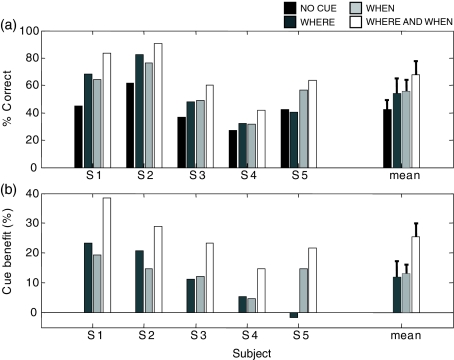
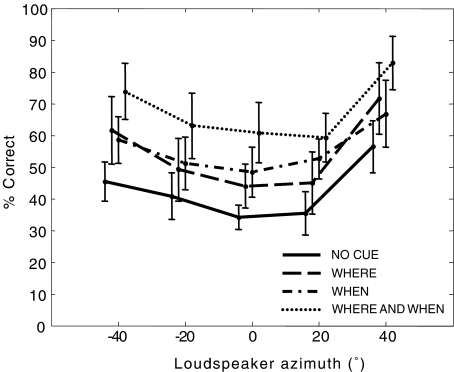
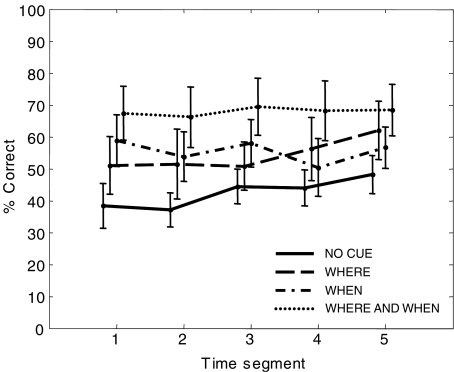
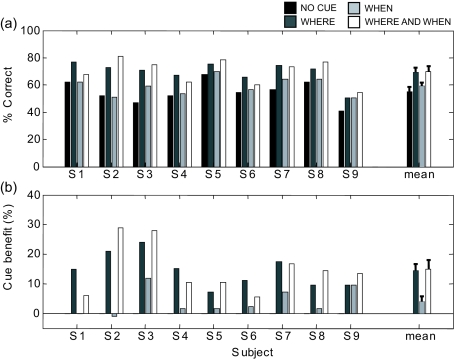
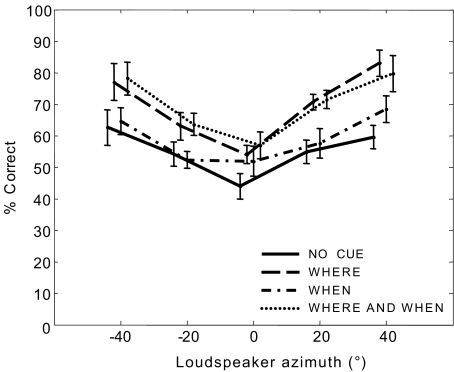
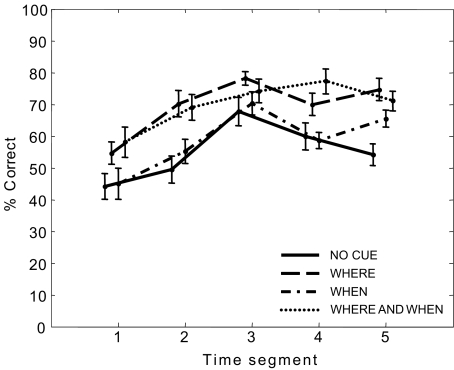
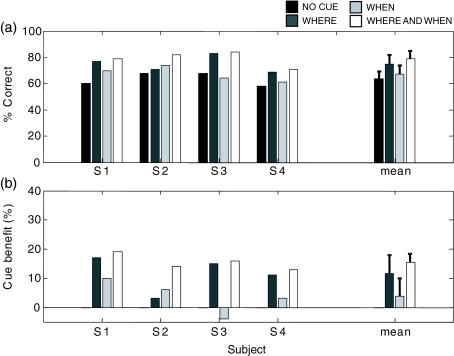
In auditory scenes containing many similar sound sources, sorting of acoustic information into streams becomes difficult, which can lead to disruptions in the identification of behaviorally relevant targets. This study investigated the benefit of providing simple visual cues for when and/or where a target would occur in a complex acoustic mixture. Importantly, the visual cues provided no information about the target content. In separate experiments, human subjects either identified learned birdsongs in the presence of a chorus of unlearned songs or recalled strings of spoken digits in the presence of speech maskers. A visual cue indicating which loudspeaker (from an array of five) would contain the target improved accuracy for both kinds of stimuli. A cue indicating which time segment (out of a possible five) would contain the target also improved accuracy, but much more for birdsong than for speech. These results suggest that in real world situations, information about where a target of interest is located can enhance its identification, while information about when to listen can also be helpful when targets are unfamiliar or extremely similar to their competitors.


Figures

FIG. 1
FIG. 1
The four attention conditions. Each panel shows a schematic time course for each of the five loudspeakers. The “T” indicates that the target would occur in a particular loudspeaker (number 2 in this example) and at a point in time corresponding to one of five random-length time segments. The shaded region indicates in which loudspeakers and time segments the LEDs would be active. Note that in the when and where and when conditions, the LEDs came on synchronously with the onset of the auditory target.
FIG. 2
FIG. 2
(a) Percent correct scores in experiment 1. Shown are individual data from the five subjects as well as the across-subject mean (error bars represent the standard error of the mean). The four bars within a group represent the four attention conditions, as labeled. (b) Cue benefits in experiment 1, calculated by subtracting scores in the no cue condition from scores in the other conditions. Shown are the individual benefits as well as the across-subject mean (error bars represent the standard error of the mean).
FIG. 3
FIG. 3
Mean percent scores in experiment 1 as a function of target loudspeaker (pooled over all subjects and all target time segments). The four lines represent the four attention conditions, as labeled. Error bars indicate standard errors of the across-subject mean, and are staggered horizontally for clarity.
FIG. 4
FIG. 4
Mean percent scores in experiment 1 as a function of target time segment (pooled over all subjects and all target loudspeakers). The four lines represent the four attention conditions, as labeled. Error bars indicate standard errors of the across-subject mean, and are staggered horizontally for clarity.
FIG. 5
FIG. 5
(a) Percent correct scores in experiment 2A. Shown are individual data from the nine subjects as well as the across-subject mean (error bars represent the standard error of the mean). The four bars within a group represent the four attention conditions, as labeled. (b) Cue benefits in experiment 2A, calculated by subtracting scores in the no cue condition from scores in the other conditions. Shown are the individual benefits as well as the across-subject mean (error bars represent the standard error of the mean).
FIG. 6
FIG. 6
Mean percent scores in experiment 2A as a function of target loudspeaker (pooled over all subjects and all target time segments). The four lines represent the four attention conditions, as labeled. Error bars indicate standard errors of the across-subject mean, and are staggered horizontally for clarity.
FIG. 7
FIG. 7
Mean percent scores in experiment 2A as a function of target time segment (pooled over all subjects and all target loudspeakers). The four lines represent the four attention conditions, as labeled. Error bars indicate standard errors of the across-subject mean, and are staggered horizontally for clarity.
FIG. 8
FIG. 8
(a) Percent correct scores in experiment 2B. Shown are individual data from the four subjects as well as the across-subject mean (error bars represent the standard error of the mean). The four bars within a group represent the four attention conditions, as labeled. (b) Cue benefits in experiment 2B, calculated by subtracting scores in the no cue condition from scores in the other conditions. Shown are the individual benefits as well as the across-subject mean (error bars represent the standard error of the mean).
FIG. 9
FIG. 9
Target-to-masker ratio (TMR) at the ear closest to the target as a function of target location. Shown are average TMRs for the birdsong stimuli of experiment 1 (solid line) and the speech stimuli of experiment 2A (dashed line). Error bars indicate standard errors of the across-token mean.

References

    1. {'text': '', 'ref_index': 1, 'ids': [{'type': 'DOI', 'value': '10.1121/1.1289366', 'is_inner': False, 'url': 'https://doi.org/10.1121/1.1289366'}, {'type': 'PubMed', 'value': '11051506', 'is_inner': True, 'url': 'https://pubmed.ncbi.nlm.nih.gov/11051506/'}]}
    2. Arbogast TL, Kidd G Jr. Evidence for spatial tuning in informational masking using the probe-signal method. J. Acoust. Soc. Am. 108:1803–1810, 2000. - PubMed
    1. {'text': '', 'ref_index': 1, 'ids': [{'type': 'DOI', 'value': '10.1250/ast.24.145', 'is_inner': False, 'url': 'https://doi.org/10.1250/ast.24.145'}]}
    2. Asemi N, Sugita Y, Suzuki Y. Auditory search asymmetry between normal Japanese speech sounds and time-reversed speech sounds distributed on the frontal-horizontal plane. Acoust. Sci. Technol. 24:145–147, 2003.
    1. {'text': '', 'ref_index': 1, 'ids': [{'type': 'DOI', 'value': '10.1038/nn1501', 'is_inner': False, 'url': 'https://doi.org/10.1038/nn1501'}, {'type': 'PMC', 'value': 'PMC1444938', 'is_inner': False, 'url': 'https://pmc.ncbi.nlm.nih.gov/articles/PMC1444938/'}, {'type': 'PubMed', 'value': '16007082', 'is_inner': True, 'url': 'https://pubmed.ncbi.nlm.nih.gov/16007082/'}]}
    2. Beck DM, Kastner S. Stimulus context modulates competition in human extrastriate cortex. Nat. Neurosci. 8:1110–1116, 2005. - PMC - PubMed
    1. {'text': '', 'ref_index': 1, 'ids': [{'type': 'DOI', 'value': '10.1121/1.2130949', 'is_inner': False, 'url': 'https://doi.org/10.1121/1.2130949'}, {'type': 'PubMed', 'value': '16419821', 'is_inner': True, 'url': 'https://pubmed.ncbi.nlm.nih.gov/16419821/'}]}
    2. Best V, Ozmeral E, Gallun FJ, Sen K, Shinn-Cunningham BG. Spatial unmasking of birdsong in human listeners: energetic and informational factors. J. Acoust. Soc. Am. 118:3766–3773, 2005. - PubMed
    1. Brungart DS, Simpson BD. Cocktail party listening in a dynamic multitalker environment. Percept. Psychophys., 2007, in press. - PubMed

Publication types

LinkOut - more resources