. 2007 Apr-May;14(3):181-92.
doi: 10.1080/10739680601139237.

Computational network model prediction of hemodynamic alterations due to arteriolar remodeling in interval sprint trained skeletal muscle

Affiliations

Computational network model prediction of hemodynamic alterations due to arteriolar remodeling in interval sprint trained skeletal muscle

Kyle W Binder et al. Microcirculation. 2007 Apr-May.

Abstract

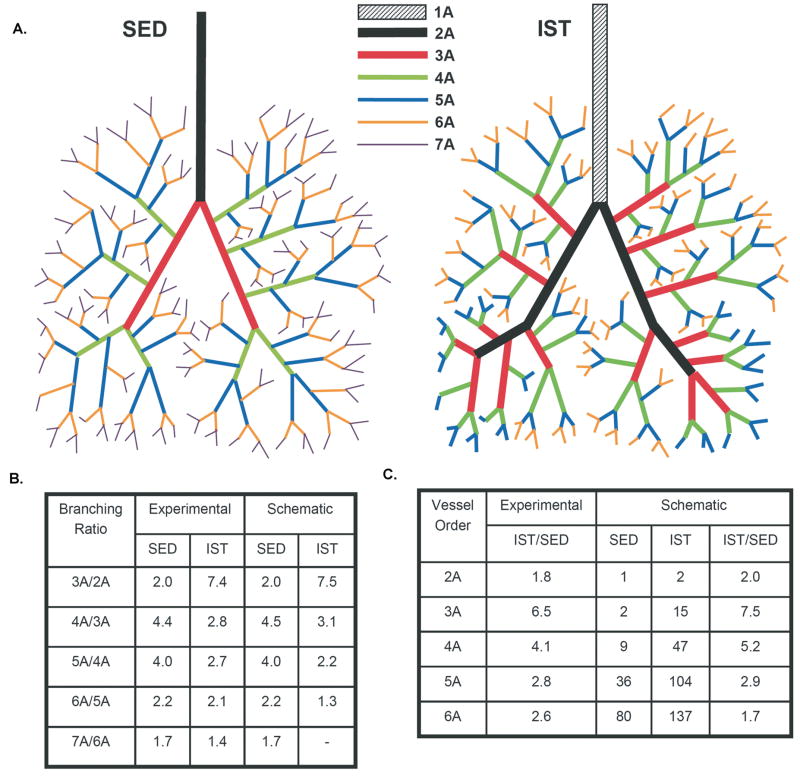
Objectives: Exercise training is known to enhance skeletal muscle blood flow capacity, with high-intensity interval sprint training (IST) primarily affecting muscles with a high proportion of fast twitch glycolytic fibers. The objective of this study was to determine the relative contributions of new arteriole formation and lumenal arteriolar remodeling to enhanced flow capacity and the impact of these adaptations on local microvascular hemodynamics deep within the muscle.

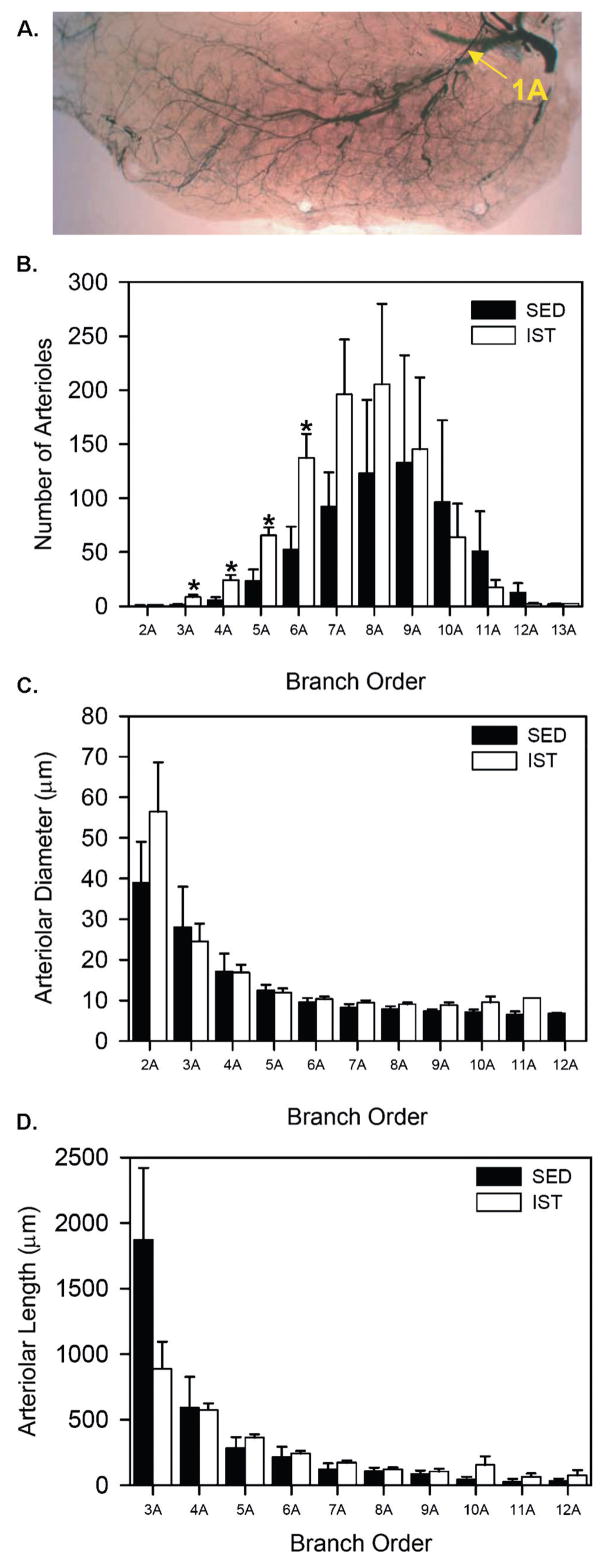
Methods: The authors studied arteriolar adaptation in the white/mixed-fiber portion of gastrocnemius muscles of IST (6 bouts of running/day; 2.5 min/bout; 60 m/min speed; 15% grade; 4.5 min rest between bouts; 5 training days/wk; 10 wks total) and sedentary (SED) control rats using whole-muscle Microfil casts. Dimensional and topological data were then used to construct a series of computational hemodynamic network models that incorporated physiological red blood cell distributions and hematocrit and diameter dependent apparent viscosities.

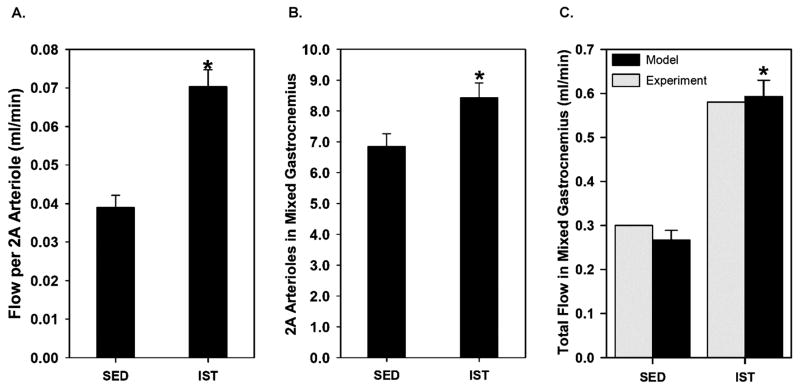
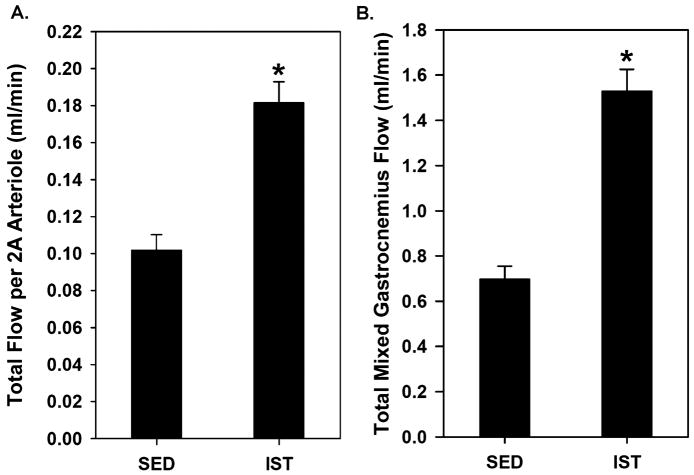
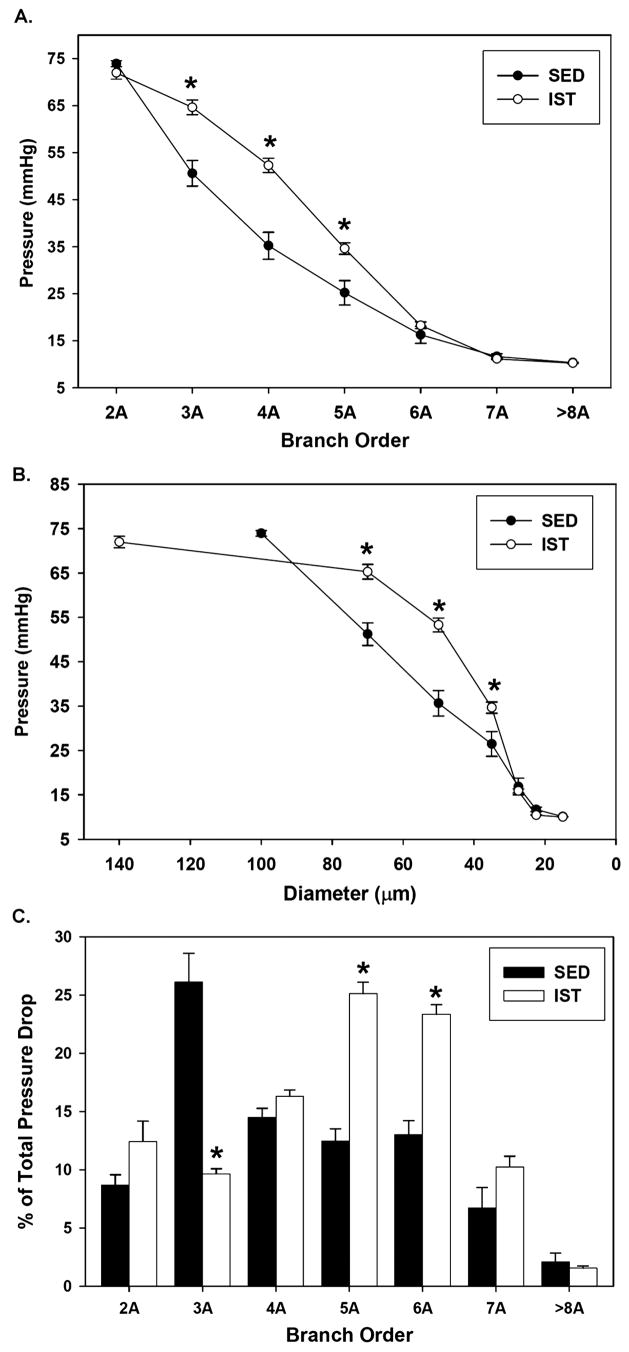
Results: In comparison to SED controls, IST elicited a significant increase in arterioles/order in the 3A through 6A generations. Predicted IST and SED flows through the 2A generation agreed closely with in vivo measurements made in a previous study, illustrating the accuracy of the model. IST shifted the bulk of the pressure drop across the network from the 3As to the 4As and 5As, and flow capacity increased from 0.7 mL/min in SED to 1.5 mL/min in IST when a driving pressure of 80 mmHg was applied.

Conclusions: The primary adaptation to IST is an increase in arterioles in the 3A through 6A generations, which, in turn, creates an approximate doubling of flow capacity and a deeper penetration of high pressure into the arteriolar network.


Figures

Figure 1
Figure 1
Network topology and dimensions of SED and IST gastrocnemius muscles. (A) Photomicrograph of a whole-mount gastrocnemius muscle from an IST-trained animal following Microfil infusion. The mixed-fiber portion of the muscle lies within the region defined by the yellow line. The arrow denotes the 1A arteriole. (B) Number of arterioles per branch order in a defined tissue volume within the mixed portion of the gastrocnemius muscle for the SED and IST groups. (C) Mean arteriolar diameter per branch order in a defined tissue volume within the mixed portion of the gastrocnemius muscle for the SED and IST groups. (D) Mean arteriolar length per branch order in a defined tissue volume within the mixed portion of the gastrocnemius muscle for the SED and IST groups. Values are means ± SEM. *Significantly different than SED within same branch order (p < .05; n = 5 for both SED and IST).
Figure 2
Figure 2
Results of simulations used to compare model predictions to experimental measurements of total flow in the white gastrocnemius muscle. (A) Model predictions of flow per 2A arteriole assuming a driving pressure at the 2A arteriole of 30 mmHg and a constant viscosity of 1.2 cP. (B) Total number of 2A arterioles in the mixed-fiber portion of the gastrocnemius muscle. (C) Model predicted and experimentally derived total flows in mixed gastrocnemius muscle. Model results were generated by multiplying flow per 2A arteriole (A) with the total number of 2A arterioles per mixed fiber region of gastrocnemius muscle (B). Experimental values were derived from isolated hindlimb studies (11, 15) that used Tyrode’s solution perfusate and a driving pressure of 40 mmHg at the abdominal aorta. Values are means ± SEM. *Significantly different than SED (p < .05, n = 10 networks for both SED and IST).
Figure 3
Figure 3
(A) Model predictions of flow per 2A arteriole in SED and IST groups, assuming a physiological input pressure of 80 mmHg and the presence of red blood cells. (B) Model predictions of total flow per mixed fiber region of gastrocnemius muscle in SED and IST groups assuming a physiological input pressure of 80 mmHg and the presence of red blood cells. Total flows were derived by scaling flow per 2A arteriole (A) with the total number of 2A arterioles per muscle (Figure 2B). Values are means ± SEM. *Significantly different than SED control (p < .05, n = 10 networks for both SED and IST).
Figure 4
Figure 4
(A) Model predictions of mean intralumenal pressure per branch order for SED and IST networks. (B) Model predictions of mean intralumenal pressure as a function of diameter for SED and IST networks. (C) Percentage of total pressure drop across the entire arteriolar network for each branch order in SED and IST networks. *Significantly different than SED in same branch order or diameter grouping (p < .05, n = 10 networks for both SED and IST).
Figure 5
Figure 5
Schematic diagram illustrating the proposed process through which arteriolar adaptations occur in response to interval sprint training. (A) At left, a hypothetical SED network with branching ratios chosen to match the experimental data presented in Figure 1 is shown. At right, in response to IST, the network has undergone arteriogenic lumenal expansion, but no arteriolar “sprouting.” (B) Experimental and schematic branching ratios for SED and IST networks. (C) Experimental and schematic ratios of IST arterioles per order to SED arterioles per order.

Similar articles

Cited by

References

    1. Adair TH, Gay WJ, Montani J-P. Growth regulation of the vascular system: evidence for a metabolic hypothesis. Am J Physiol. 1990;259:393–404. - PubMed
    1. Armstrong RB, Laughlin MH. Exercise blood flow patterns within and among rat muscles after training. Am J Physiol Heart Circ Physiol. 1984;246:H59–H68. - PubMed
    1. Dudley GA, Abraham WM, Terjung RL. Influence of exercise intensity and duration on biochemical adaptations in skeletal muscle. J Appl Physiol. 1982;53:844–850. - PubMed
    1. Greene AS, Tonellato PJ, Lui J, Lombard JH, Cowley AW., Jr Microvascular rarefaction and tissue vascular resistance in hypertension. Am J Physiol Heart Circ Physiol. 1989;256:H126–H131. - PubMed
    1. Gute D, Fraga C, Laughlin MH, Amann JF. Regional changes in capillary supply in skeletal muscle of high-intensity endurance-trained rats. J Appl Physiol. 1996;81:619–626. - PubMed

Publication types