. 2008 Mar;29(3):346-62.
doi: 10.1002/hbm.20395.

Using the wild bootstrap to quantify uncertainty in diffusion tensor imaging

Affiliations

Using the wild bootstrap to quantify uncertainty in diffusion tensor imaging

Brandon Whitcher et al. Hum Brain Mapp. 2008 Mar.

Abstract

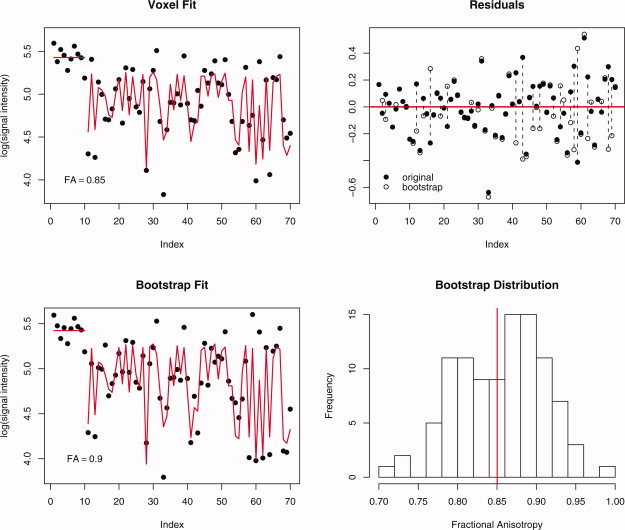
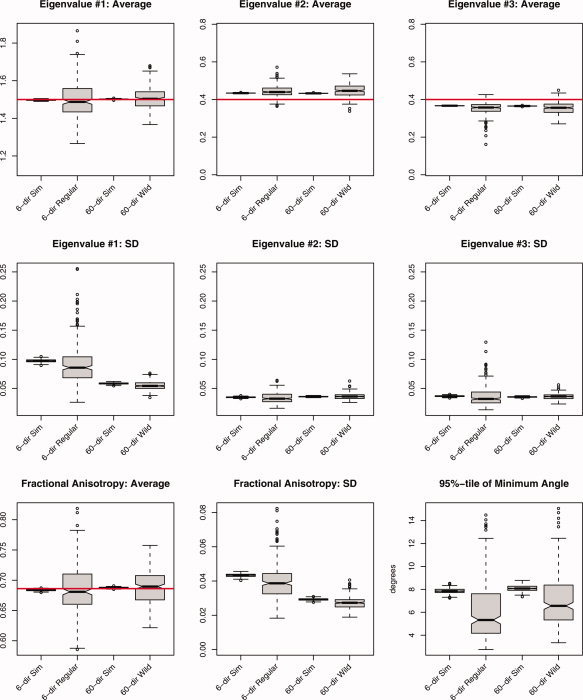
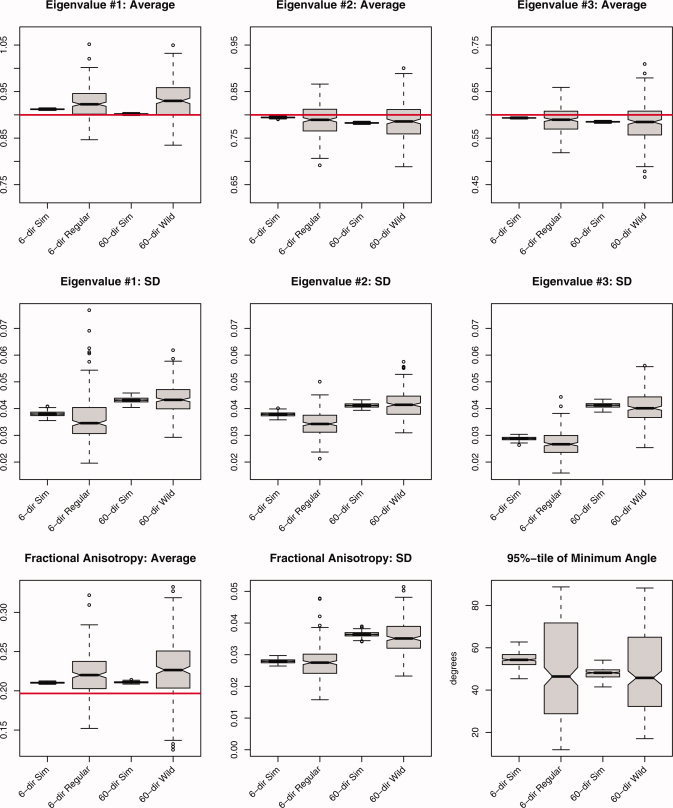
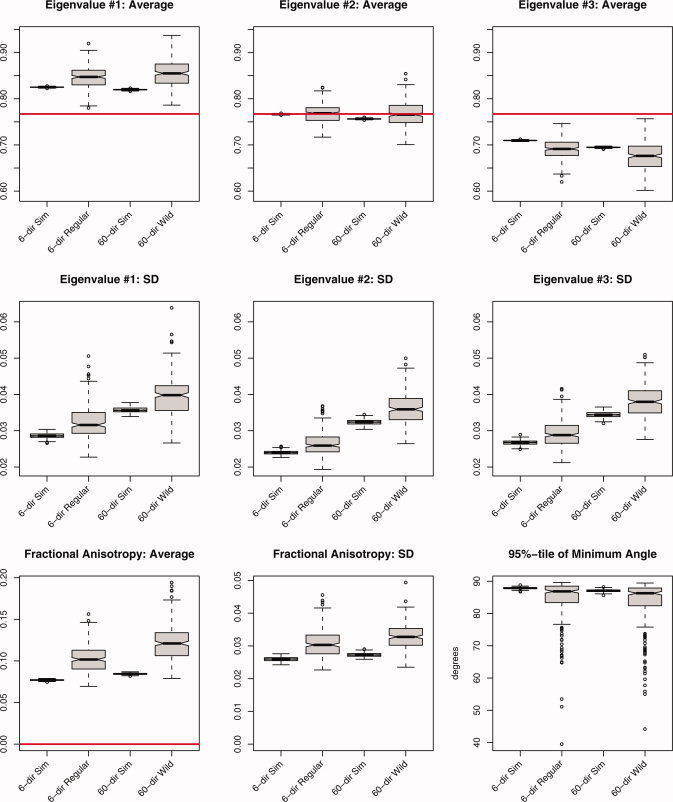
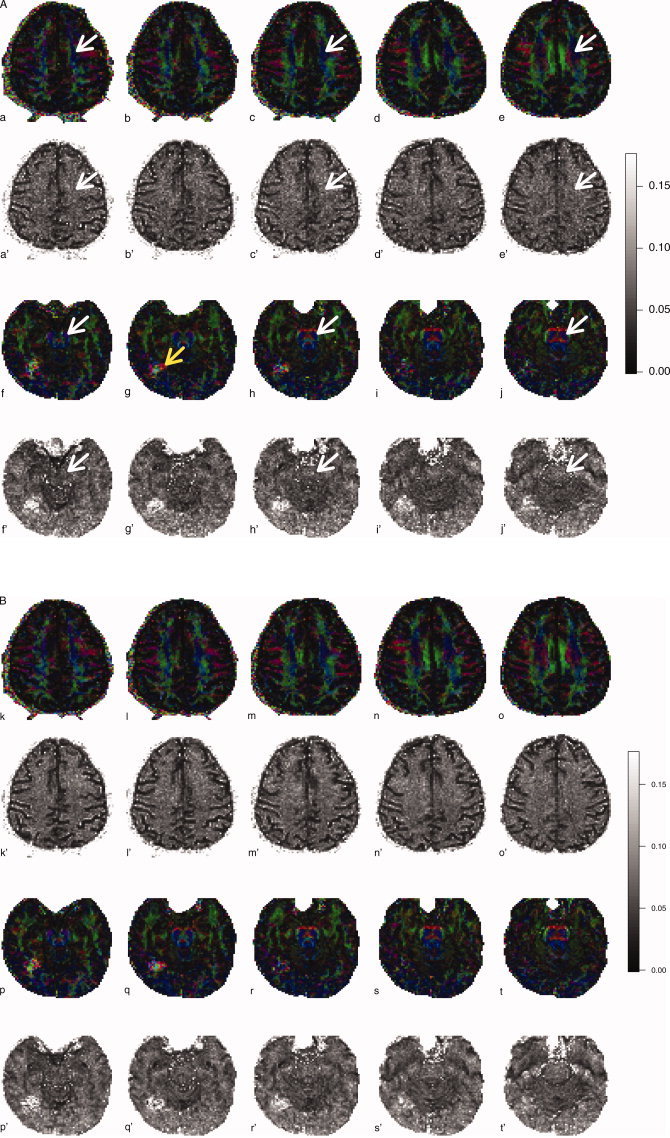
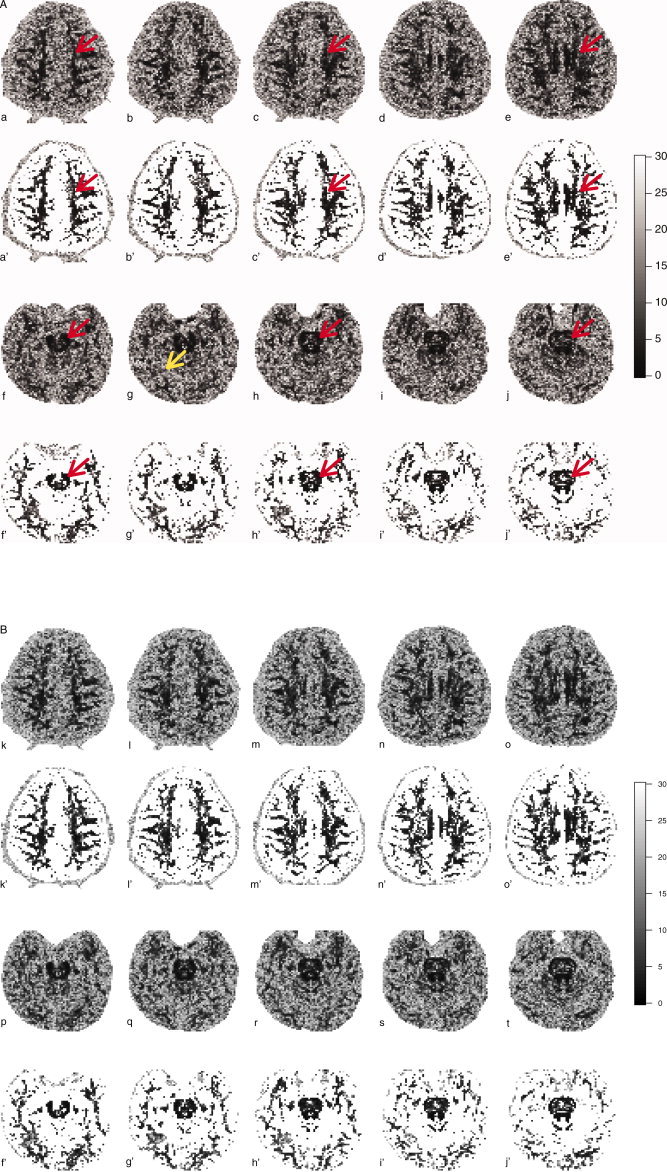
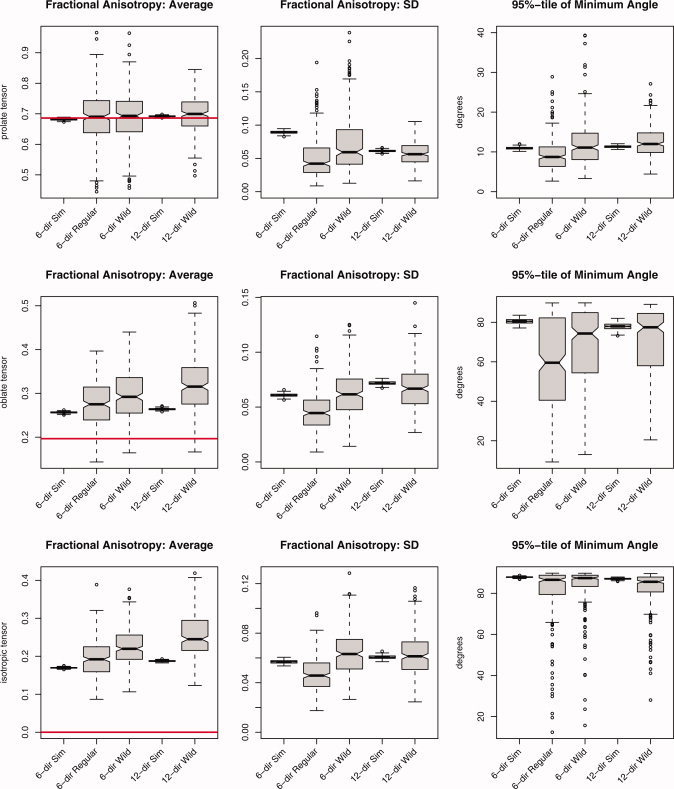
Estimation of noise-induced variability in diffusion tensor imaging (DTI) is needed to objectively follow disease progression in therapeutic monitoring and to provide consistent readouts of pathophysiology. The noise variability of nonlinear quantities of the diffusion tensor (e.g., fractional anisotropy, fiber orientation, etc.) have been quantified using the bootstrap, in which the data are resampled from the experimental averages, yet this approach is only applicable to DTI scans that contain multiple averages from the same sampling direction. It has been shown that DTI acquisitions with a modest to large number of directions, in which each direction is only sampled once, outperform the multiple averages approach. These acquisitions resist the traditional (regular) bootstrap analysis though. In contrast to the regular bootstrap, the wild bootstrap method can be applied to such protocols in which there is only one observation per direction. Here, we compare and contrast the wild bootstrap with the regular bootstrap using Monte Carlo numerical simulations for a number of diffusion scenarios. The regular and wild bootstrap methods are applied to human DTI data and empirical distributions are obtained for fractional anisotropy and the diffusion tensor eigensystem. Spatial maps of the estimated variability in the diffusion tensor principal eigenvector are provided. The wild bootstrap method can provide empirical distributions for tensor-derived quantities, such as fractional anisotropy and principal eigenvector direction, even when the exact distributions are not easily derived.


Figures

Figure 1
Figure 1
Graphical illustration of the wild bootstrap on a single voxel where b = 0 for indices 1–10 and b = 700 s/mm2 for indices 11–70; (a) observations and fitted values from the diffusion tensor, (b) original and bootstrap residuals from the model fit, (c) bootstrap observations with new fitted values, and (d) bootstrap distribution of fractional anisotropy. [Color figure can be viewed in the online issue, which is available at www.interscience.wiley.com.]
Figure 2
Figure 2
Summary statistics derived from 250 iterations of the simulation study using a prolate tensor (λ1, λ2, λ3) = (1.5, 0.4, 0.4) μm2/ms, FA ≈ 0.69, SNR = 20. The average and standard deviation (SD) were computed for all three eigenvalues, fractional anisotropy, and the 95 percentile in the minimum angle subtended, under both acquisition schemes (6‐ and 60‐directions) and the three methods (Monte Carlo simulation, regular bootstrap, and wild bootstrap). The labels correspond to, from left to right, 6‐directions (NEX = 10) using MC simulation, 6‐directions (NEX = 10) using the regular bootstrap, 60‐directions using MC simulation, and 60‐directions using the wild bootstrap. [Color figure can be viewed in the online issue, which is available at www.interscience.wiley.com.]
Figure 3
Figure 3
Summary statistics derived from 250 iterations of the simulation study using an oblate tensor (λ1, λ2, λ3) = (0.9, 0.8, 0.6) μm2/ms, FA ≈ 0.20, SNR = 20. The average and standard deviation (SD) were computed for all three eigenvalues, fractional anisotropy, and the 95 percentile in the minimum angle subtended, under both acquisition schemes (6‐ and 60‐directions) and the three methods (Monte Carlo simulation, regular bootstrap, and wild bootstrap). The labels are identical to those in Figure 2. [Color figure can be viewed in the online issue, which is available at www.interscience.wiley.com.]
Figure 4
Figure 4
Summary statistics derived from 250 iterations of the simulation study using an isotropic tensor (λ1, λ2, λ3) = (0.767, 0.767, 0.767) μm2/ms, SNR = 20. The average and standard deviation (SD) were computed for all three eigenvalues, fractional anisotropy, and the 95 percentile in the minimum angle subtended, under both acquisition schemes (6‐ and 60‐directions) and the three methods (Monte Carlo simulation, regular bootstrap, and wild bootstrap). The labels are identical to those in Figure 2. [Color figure can be viewed in the online issue, which is available at www.interscience.wiley.com.]
Figure 5
Figure 5
Fractional anisotropy, colored by principal eigenvector, for a single subject scanned using both 6‐direction and 60‐direction sequences. Standard errors from the regular bootstrap are provided for the 6‐direction sequence and from the wild bootstrap for the 60‐direction sequence. Both sets of bootstrap SEs are displayed in FA units (ranging from 0 to 0.175). Centrum semiovale (top rows) and caudal midbrain/rostral pons (bottom rows) are demarcated on alternating slices of the 6‐direction sequence only (white arrows). A region of FA disruption can be seen in the inferior temporal lobe near the fusiform gyrus (yellow arrow).
Figure 6
Figure 6
Bootstrap estimates of the standard error (SE) for the principal eigenvector Euler angle, obtained from the regular bootstrap for the 6‐direction acquisition and from the wild bootstrap for the 60‐direction acquisition. The first and third rows show all values from 0° ≤ SE ≤ 30° and the second and fourth rows only displays voxels with an FA > 0.4. Centrum semiovale (top rows) and caudal midbrain/rostral pons (bottom rows) are demarcated on alternating slices of the 6‐direction sequence only (red arrows). The region of FA disruption in the inferior temporal lobe near the fusiform gyrus that was seen in the FA color map is delineated by the yellow arrow.
Figure 7
Figure 7
Summary statistics for fractional anisotropy and the 95 percentile in the minimum angle subtended derived from 250 iterations of the simulation study using all three diffusion tensor models (prolate, oblate, and isotropic), SNR = 20. The labels correspond to, from left to right, 6‐directions (NEX = 2) using MC simulation, 6‐directions (NEX = 2) using the regular bootstrap, 6‐directions (NEX = 2) using the wild bootstrap, 12‐directions using MC simulation, and 12‐directions using the wild bootstrap. [Color figure can be viewed in the online issue, which is available at www.interscience.wiley.com.]

Similar articles

Cited by

References

    1. Anderson AW( 2001): Theoretical analysis of the effects of noise on diffusion tensor imaging. Magn Reson Med 46: 1174–1188. - PubMed
    1. Basford KE, Greenway DR, McLachlan GJ, Peel D( 1997): Standard errors of fitted means under normal mixture models. Comput Stat 12: 1–17.
    1. Basser PJ, Mattiello J, LeBihan D( 1994): Estimation of the effective self‐diffusion tensor from the NMR spin echo. J Magn Reson 103: 247–254. - PubMed
    1. Batchelor PG, Atkinson D, Hill DLG, Calamante F, Connelly A( 2003): Anisotropic noise propagation in diffusion tensor MRI sampling schemes. Magn Reson Med 49: 1143–1151. - PubMed
    1. Behrens TEJ, Woolrich MW, Jenkinson M, Johansen‐Berg H, Nunes RG, Clare S, Matthews PM, Brady JM, Smith SM( 2003): Characterization and propogation of uncertainty in diffusion‐weighted MR imaging. Magn Reson Med 50: 1077–1088. - PubMed

Publication types