. 2007 May;5(5):e133.
doi: 10.1371/journal.pbio.0050133.

Gamma oscillations in human primary somatosensory cortex reflect pain perception

Affiliations

Gamma oscillations in human primary somatosensory cortex reflect pain perception

Joachim Gross et al. PLoS Biol. 2007 May.

Abstract

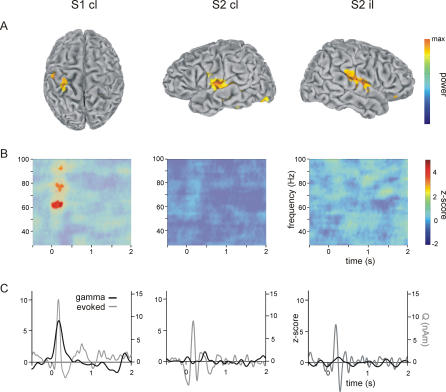
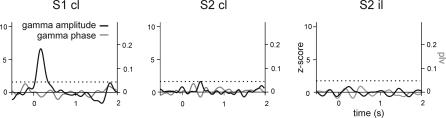
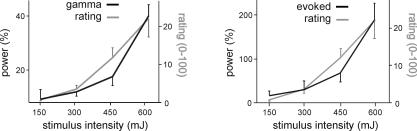
Successful behavior requires selection and preferred processing of relevant sensory information. The cortical representation of relevant sensory information has been related to neuronal oscillations in the gamma frequency band. Pain is of invariably high behavioral relevance and, thus, nociceptive stimuli receive preferred processing. Here, by using magnetoencephalography, we show that selective nociceptive stimuli induce gamma oscillations between 60 and 95 Hz in primary somatosensory cortex. Amplitudes of pain-induced gamma oscillations vary with objective stimulus intensity and subjective pain intensity. However, around pain threshold, perceived stimuli yielded stronger gamma oscillations than unperceived stimuli of equal stimulus intensity. These results show that pain induces gamma oscillations in primary somatosensory cortex that are particularly related to the subjective perception of pain. Our findings support the hypothesis that gamma oscillations are related to the internal representation of behaviorally relevant stimuli that should receive preferred processing.


Conflict of interest statement

Competing interests. The authors have declared that no competing interests exist.

Figures

Figure 1
Figure 1. Pain-Induced Gamma Oscillations in Somatosensory Cortices
(A) Group mean locations of contralateral primary (S1 cl) and bilateral secondary somatosensory (S2 cl and S2 il) cortices. Locations were obtained from analysis of evoked responses to noxious laser stimuli. Individual tomographic maps of pain-evoked power increases were calculated and averaged across subjects, resulting in a group-mean tomographic map of pain-evoked power increases with dimensionless values (see Methods for details). Talairach coordinates of activations were: −20,−37, and 57 (S1 cl), −45,−15, and 22 (S2 cl), and 50,−16, and 19 (S2 il). The additional colored voxels were not consistently found in single participants and have not been included in further analysis. (B) Group-mean TFRs for each of the three areas. The TFRs show power as a function of time and frequency. Power is coded as z-score calculated from a 1,000-ms baseline period. Significance of activations was determined by using permutation statistics; areas below the 95% confidence level are masked by transparent gray shading. Significant oscillations following noxious stimuli (stimulus onset at 0 ms) are evident in contralateral S1 in the high gamma range at a latency of about 200 ms. Please note that the different frequency peaks do not represent harmonics, but result from interindividual variability in frequency of gamma oscillations. No significant oscillations can be seen for bilateral S2 at any time. (C) Group-mean amplitudes of induced gamma oscillations (60–95 Hz, black lines) and evoked activity (gray lines) from contralateral S1 and bilateral S2. The left and right axes and labels correspond to evoked activity and induced gamma oscillations, respectively. Evoked activity is given in source strength and induced gamma oscillations are given in z-scores. Evoked activity and induced gamma oscillations in S1 show the same peak latency (evoked: 190 ± 10 ms; induced gamma: 192 ± 15 ms; mean ± the standard error of the mean [s.e.m]; p > 0.8, two-tailed Wilcoxon signed-rank test).
Figure 2
Figure 2. Gamma Amplitude and Gamma Phase Locking in Somatosensory Cortices
Gamma amplitude (black line) and gamma phase locking (plv, gray line) are shown for the contralateral primary somatosensory cortex (S1 cl) and the bilateral secondary somatosensory cortices (S2 cl and S2 il). The left and right axes and labels correspond to amplitude and phase, respectively. Amplitudes are given in z-scores, and phase is given as phase-locking value (plv; see Methods). The dotted line represents the confidence level as determined from permutation statistics. The increase of gamma oscillations (black line) without a significant change of phase locking (gray line) confirms that gamma oscillations are induced and not evoked.
Figure 3
Figure 3. Pain Intensity, Amplitudes of Induced Gamma Oscillations, and Amplitudes of Evoked Responses as a Function of Stimulus Intensity
Mean power changes of induced gamma oscillations (black line, left panel) and evoked activity (black line, right panel) at 100–300 ms with respect to baseline were computed for all four stimulus intensities and compared to mean pain ratings (gray lines). Error bars depict ± the standard error of the mean (s.e.m.) Induced gamma oscillations, evoked responses, and pain intensity increase with stimulus intensity. Spearman's correlation coefficient between induced gamma oscillations and pain intensity was 0.96 (p = 0.003), and between evoked responses and pain intensity was 0.99 (p = 0.012).
Figure 4
Figure 4. Amplitudes of Induced Gamma Oscillations and Evoked Responses to Differently Perceived Stimuli of Equal Stimulus Intensity
(A) Trials rated with zero (“no percept,” black bars) were compared to trials with higher ratings (“percept,” gray bars) but the same stimulus intensity. Amplitudes of responses were calculated as relative power changes as compared to baseline. Mean rating of “percept” trials was seven, the mean number of trials per subject was 16. “Percept” and “no percept” trials were equally distributed across the recording session (ratio of the number of “percept” and “no percept” trials compared across quarters of the recording session; p = 0.14; Friedman's analysis of variance). Mean amplitudes of gamma oscillations in S1 at 100–300 ms were significantly stronger for “percept” trials as compared to “no percept” trials. Amplitudes of evoked responses from S1 did not differ between conditions. The asterisk (*) indicates p < 0.05. (B) TFR of the difference between “percept” and “no percept” trials. Power is coded as relative power change as compared to baseline. The figure represents a subtraction of the “percept” and “no-percept” TFRs, and demonstrates “percept”-specific enhanced gamma oscillations at a maximum latency of about 200 ms. (C) Group-mean amplitude differences between “percept” and “no percept” trials. The black line shows amplitudes of induced gamma oscillations as relative power changes as compared to baseline, and the gray line shows amplitudes of evoked responses calculated as source strengths from S1. The dotted line represents the 95% confidence interval calculated from baseline. Gamma amplitudes are significantly different between “percept” and “no percept” trials, whereas amplitudes of evoked responses did not differ between trial sets.

References

    1. Engel AK, Singer W. Temporal binding and the neural correlates of sensory awareness. Trends Cogn Sci. 2001;5:16–25. - PubMed
    1. Singer W. Neuronal synchrony: A versatile code for the definition of relations? Neuron. 1999;24:49–65. 111–125. - PubMed
    1. Fries P, Reynolds JH, Rorie AE, Desimone R. Modulation of oscillatory neuronal synchronization by selective visual attention. Science. 2001;291:1560–1563. - PubMed
    1. Fries P. A mechanism for cognitive dynamics: Neuronal communication through neuronal coherence. Trends Cogn Sci. 2005;9:474–480. - PubMed
    1. Muller MM, Keil A. Neuronal synchronization and selective color processing in the human brain. J Cogn Neurosci. 2004;16:503–522. - PubMed

Publication types