. 2007;8(4):R64.
doi: 10.1186/gb-2007-8-4-r64.

Discovery of tissue-specific exons using comprehensive human exon microarrays

Affiliations

Discovery of tissue-specific exons using comprehensive human exon microarrays

Tyson A Clark et al. Genome Biol. 2007.

Abstract

Background: Higher eukaryotes express a diverse population of messenger RNAs generated by alternative splicing. Large-scale methods for monitoring gene expression must adapt in order to accurately detect the transcript variation generated by this splicing.

Results: We have designed a high-density oligonucleotide microarray with probesets for more than one million annotated and predicted exons in the human genome. Using these arrays and a simple algorithm that normalizes exon signal to signal from the gene as a whole, we have identified tissue-specific exons from a panel of 16 different normal adult tissues. RT-PCR validation confirms approximately 86% of the predicted tissue-enriched probesets. Pair-wise comparisons between the tissues suggest that as many as 73% of detected genes are differentially alternatively spliced. We also demonstrate how an inclusive exon microarray can be used to discover novel alternative splicing events. As examples, 17 new tissue-specific exons from 11 genes were validated by RT-PCR and sequencing.

Conclusion: In conjunction with a conceptually simple algorithm, comprehensive exon microarrays can detect tissue-specific alternative splicing events. Our data suggest significant expression outside of known exons and well annotated genes and a high frequency of alternative splicing events. In addition, we identified and validated a number of novel exons with tissue-specific splicing patterns. The tissue map data will likely serve as a valuable source of information on the regulation of alternative splicing.


Figures

Figure 1
Figure 1
Exon microarray design. Input sequences from a variety of sources were projected onto the November 2002 version of the human genome (hg13). Where possible, up to four probe pairs were selected for each PSR. Probesets that overlap Ensembl or RefSeq sequences are labeled 'Supported.' Probesets that fall within the genomic boundaries of a transcript cluster are labeled 'Bounded.'
Figure 2
Figure 2
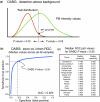
Determination of detection above background. To determine if a given probe signal is detected above background, the PM intensity is compared to a distribution of background probes with the same G/C content. A p value is calculated representing the probability that the signal intensity is part of the null distribution. Probes with DABG p values of less than 0.05 are considered to be detected above background. For this study, the mismatch probes from PSRs supported solely by GenScan Suboptimal predictions were used to create the null distributions. (a) Diagram depicting the comparison of background signal to PM signal. PM signal intensities at the 95% of background probes with the same GC content are given a p value of 0.05. (b) ROC curve of the median DABG p value from all 48 samples. The area under the curve (AUC) is used as a measure of ability of the metric to differentiate between expressed and non-expressed sequences. The sensitivity and specificity values are shown for a DABG p value cutoff of 0.05. (c) Table of the median sensitivity and specificity values for each tissue using a DABG p value cutoff of 0.05.
Figure 3
Figure 3
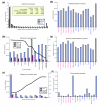
Probeset and transcript cluster detection. (a) Bounded, supported, and probesets that fit into neither category are binned by the number of tissues the probeset is detected in. For this and all further analyses, a probeset must have a DABG p value less than 0.05 in all 3 biological replicates of a tissue to be considered detected. (b) Total number and number of detected probesets listed by evidence type. One probeset may fall into more than one category. Percent detected value is the average detection rate across the 16 tissues. (c) Total number and number of detected probesets listed by number of types of evidence. Percent detected value is the average detection rate across the 16 tissues. (d) Total number of probesets detected in each tissue. (e) Total number of transcript clusters detected in each tissue. For a transcript cluster to be considered detected, a minimum of 50% of Ensembl/RefSeq supported probesets must have DABG p values less than 0.05 for at least 2 of 3 replicates. (f) Probesets expressed in only one tissue. To be counted a probeset must be detected in all three replicates and not in all three replicates of any other tissue. The 'brain' category represents probesets detected in all three replicates of at least one of the six brain tissues and detected in all three replicates of any non-brain tissues (excluding spinal cord).
Figure 4
Figure 4
Splicing Index. (a) Splicing Index equations. (b) PHLDB1: brain-specific Splicing Index values graphed for all Ensembl/RefSeq supported probesets and RT-PCR validation using primers in flanking exons. (c) SLC9A7: graphed as in (b).
Figure 5
Figure 5
RT-PCR validation of brain-enriched exons identified by the Splicing Index algorithm. Approximately 15 μl of PCR product were separated on a 2.5% agarose gel stained with ethidium bromide. Primers are designed to well annotated exons that flank the PSR identified as brain enriched by the Splicing Index. Primer sequences are available in Additional data file 9.
Figure 6
Figure 6
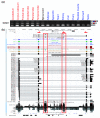
Discovery of novel exons. (a) RT-PCR validation of predicted brain-enriched exons. (b) Sequences of RT-PCR products from parietal lobe RNA aligned to the human genome using the BLAT tool [36] available on the UCSC Genome Browser website [53].

References

    1. Black DL. Mechanisms of alternative pre-messenger RNA splicing. Annu Rev Biochem. 2003;72:291–336. doi: 10.1146/annurev.biochem.72.121801.161720. - DOI - PubMed
    1. Boise LH, Gonzalez-Garcia M, Postema CE, Ding L, Lindsten T, Turka LA, Mao X, Nunez G, Thompson CB. bcl-x, a bcl-2-related gene that functions as a dominant regulator of apoptotic cell death. Cell. 1993;74:597–608. doi: 10.1016/0092-8674(93)90508-N. - DOI - PubMed
    1. Faustino NA, Cooper TA. Pre-mRNA splicing and human disease. Genes Dev. 2003;17:419–437. doi: 10.1101/gad.1048803. - DOI - PubMed
    1. Krawczak M, Reiss J, Cooper DN. The mutational spectrum of single base-pair substitutions in mRNA splice junctions of human genes: causes and consequences. Hum Genet. 1992;90:41–54. doi: 10.1007/BF00210743. - DOI - PubMed
    1. Kan Z, Rouchka EC, Gish WR, States DJ. Gene structure prediction and alternative splicing analysis using genomically aligned ESTs. Genome Res. 2001;11:889–900. doi: 10.1101/gr.155001. - DOI - PMC - PubMed

Associated data