

A set of genes that regulate cell proliferation predicts treatment outcome in childhood acute lymphoblastic leukemia
- PMID: 17456722
- PMCID: PMC1939904
- DOI: 10.1182/blood-2007-01-068478
A set of genes that regulate cell proliferation predicts treatment outcome in childhood acute lymphoblastic leukemia
Abstract
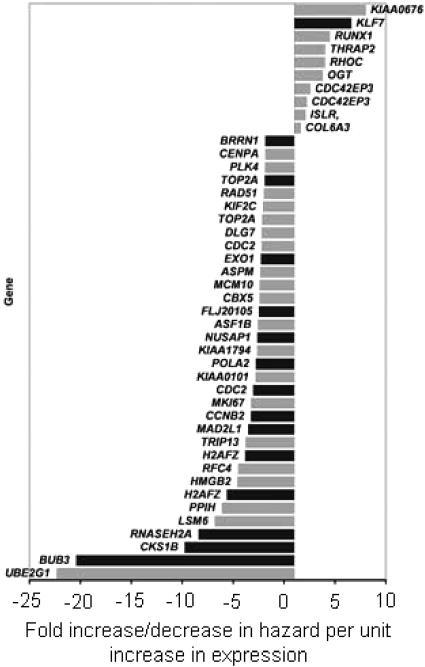
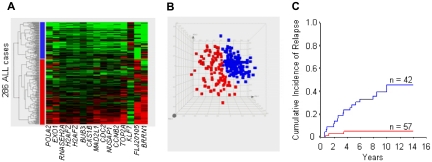
To identify novel predictors of outcome in childhood acute lymphoblastic leukemia (ALL), we analyzed gene expression in the leukemic cells of 187 children with newly diagnosed ALL and compared the findings with minimal residual disease (MRD) results obtained on day 19 of remission induction treatment. Genes that showed a significant relationship to MRD were then tested for their capacity to predict leukemic relapse in an independent cohort of 99 patients. We identified 674 probe sets that were associated with MRD on day 19 (P < .006); 40 of the identified genes predicted relapse (P < .03). Among these, 14 showed independent prognostic significance after adjustment for age, leukocyte count at diagnosis, and genetic subtype. More than half of the 40 genes and nearly all of the 14 genes were functionally related, as indicated by their roles in the regulation of cell proliferation. Underexpression of genes promoting cell proliferation was associated with resistance to chemotherapy. The biologic processes regulated by the genes we identified appear to be key determinants of the early cytoreductive response to remission induction therapy and subsequent clinical outcome in childhood ALL. Incorporation of the expression levels of these genes into existing strategies of risk classification could improve clinical management.
Figures


Comment in
-
Predicting outcome in childhood acute lymphoblastic leukemia using gene expression profiling: prognostication or protocol selection?Blood. 2008 Feb 15;111(4):2486-7; author reply 2487-8. doi: 10.1182/blood-2007-10-121327. Blood. 2008. PMID: 18263786 No abstract available.
References
-
- Pui CH, Evans WE. Treatment of acute lymphoblastic leukemia. N Engl J Med. 2006;354:166–178. - PubMed
-
- Riehm H, Reiter A, Schrappe M, et al. Corticosteroid-dependent reduction of leukocyte count in blood as a prognostic factor in acute lymphoblastic leukemia in childhood (therapy study ALL-BFM 83). Klin Padiatr. 1987;199:151–160. - PubMed
-
- Lilleyman JS, Gibson BE, Stevens RF, et al. Clearance of marrow infiltration after 1 week of therapy for childhood lymphoblastic leukaemia: clinical importance and the effect of daunorubicin. The Medical Research Council's Working Party on Childhood Leukaemia. Br J Haematol. 1997;97:603–606. - PubMed
-
- Steinherz PG, Gaynon PS, Breneman JC, et al. Cytoreduction and prognosis in acute lymphoblastic leukemia: the importance of early marrow response: report from the Childrens Cancer Group. J Clin Oncol. 1996;14:389–398. - PubMed
-
- Sandlund JT, Harrison PL, Rivera G, et al. Persistence of lymphoblasts in bone marrow on day 15 and days 22 to 25 of remission induction predicts a dismal treatment outcome in children with acute lymphoblastic leukemia. Blood. 2002;100:43–47. - PubMed
Publication types
MeSH terms
Substances
Grants and funding
LinkOut - more resources
Full Text Sources
Other Literature Sources
Medical
Molecular Biology Databases
