. 2007 May;170(5):1695-712.
doi: 10.2353/ajpath.2007.060677.

Elevated neuronal expression of CD200 protects Wlds mice from inflammation-mediated neurodegeneration

Affiliations

Elevated neuronal expression of CD200 protects Wlds mice from inflammation-mediated neurodegeneration

Tanuja Chitnis et al. Am J Pathol. 2007 May.

Abstract

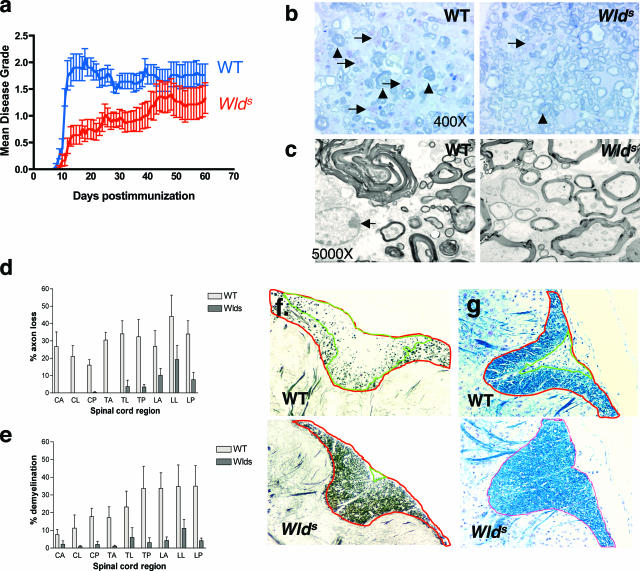
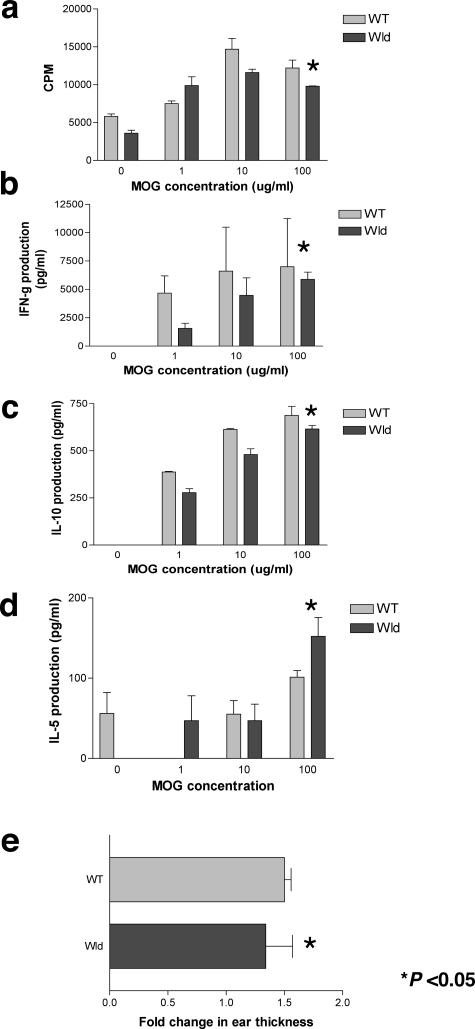
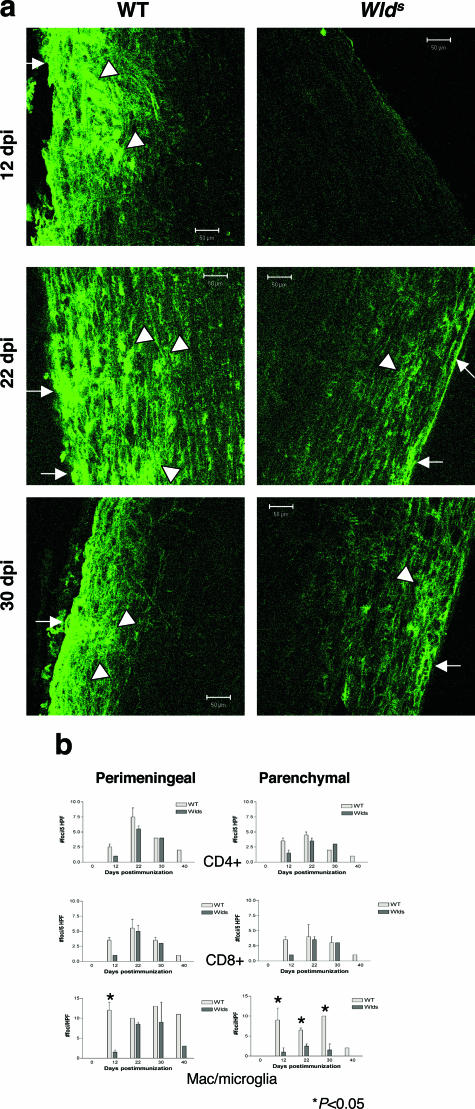
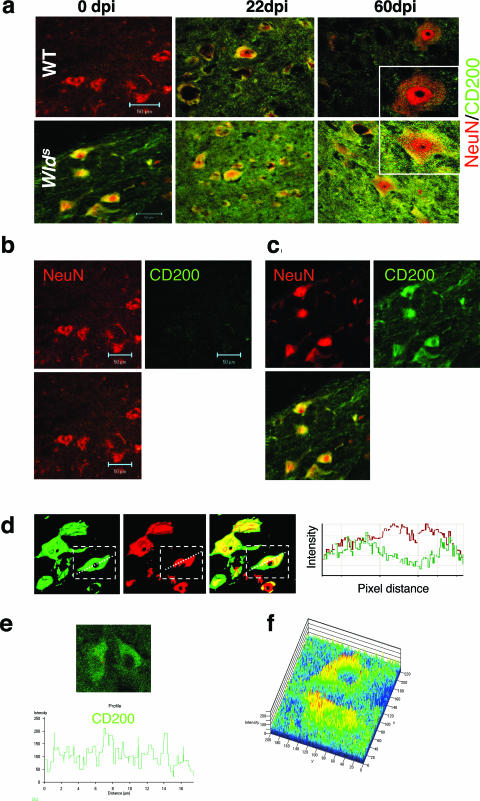
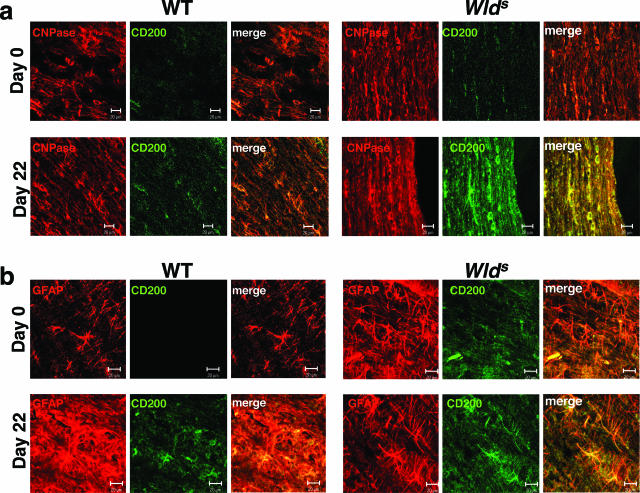
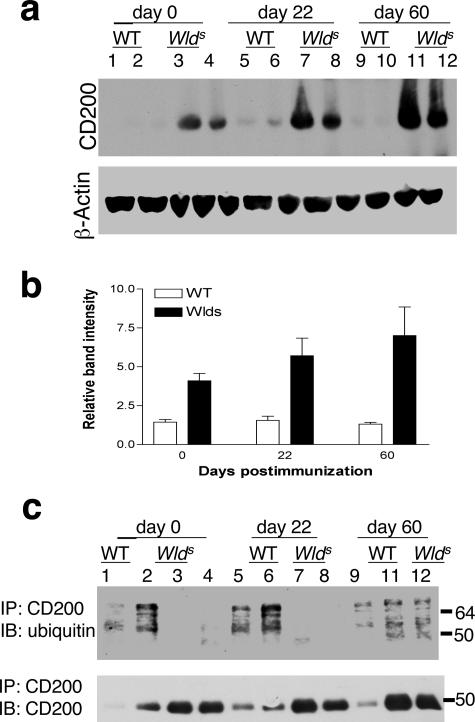
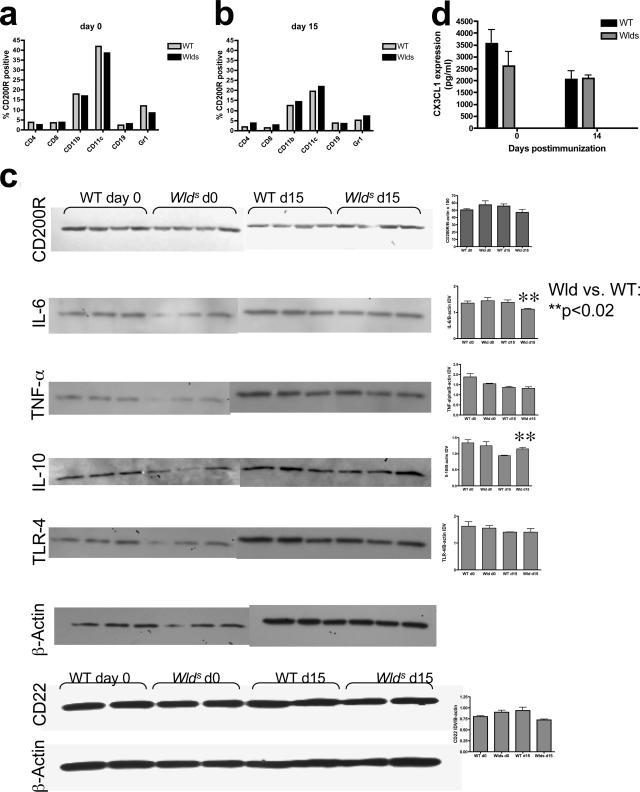
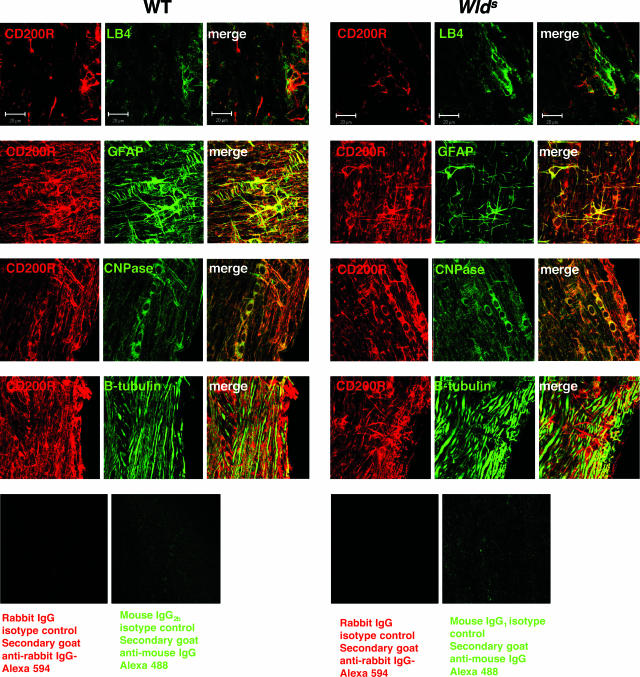
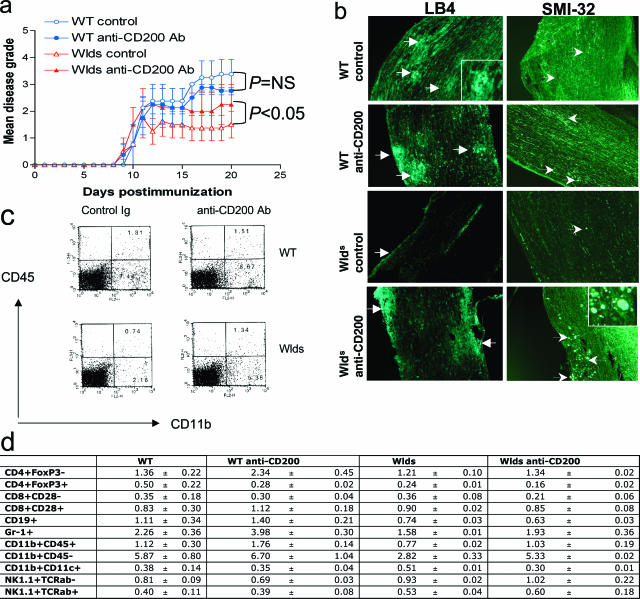
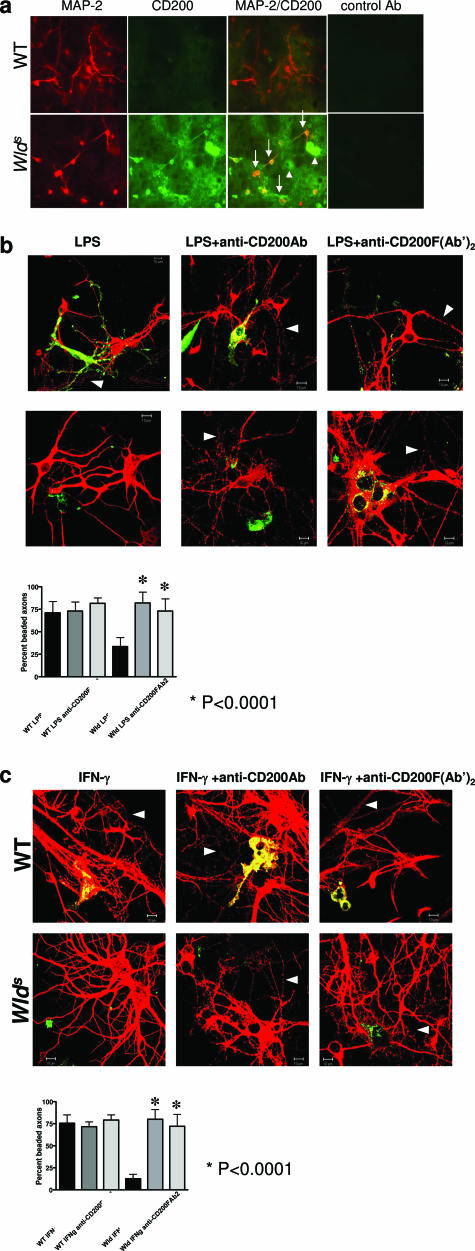
Axonal damage secondary to inflammation is likely the substrate of chronic disability in multiple sclerosis and is found in the animal model of experimental autoimmune encephalomyelitis (EAE). Wld(s) mice have a triplication of the fusion gene Ube4b/Nmnat and a phenotype of axon protection. Wld(s) mice develop an attenuated disease course of EAE, with decreased demyelination, reduced axonal pathology, and decreased central nervous system (CNS) macrophage and microglial accumulation. We show that attenuated disease in Wld(s) mice was associated with robust constitutive expression of the nonsignaling CD200 molecule on neurons in the CNS compared with control mice. CD200 interacts with its signaling receptor CD200R, which we found to be expressed on microglia, astrocytes, and oligodendrocytes at similar levels in control and Wld(s) mice. Administration of blocking anti-CD200 antibody to Wld(s) mice abrogated disease attenuation and was associated with increased CNS inflammation and neurodegeneration. In vitro, Wld(s) neuronal cultures were protected from microglial-induced neurotoxicity compared with control cultures, but protection was abrogated by anti-CD200 antibody. The CD200-CD200R pathway plays a critical role in attenuating EAE and reducing inflammation-mediated damage in the CNS. Strategies that up-regulate the expression of CD200 in the CNS or molecules that ligate the CD200R may be relevant as neuroprotective strategies in multiple sclerosis.


Figures

Figure 1
Figure 1
Wlds mice have an attenuated course of EAE with less axonal loss and demyelination. a: Wlds and WT mice were immunized with 150 μg of MOGp35-55. EAE disease grade was followed daily from day 0 to 60. Shown is the mean disease grade ±SE from a composite of five separate experiments (28 Wlds mice, 16 WT mice). Wlds mice experience an attenuated course of disease. b: Representative toluidine blue-stained sections from the lateral lumbar spinal cord from WT and Wlds mice on day 25 after immunization show more severe demyelination, axonal loss (arrowheads), and general tissue destruction in WT mice. In addition, more macrophages/microglia are present in WT sections (arrows). c: Electron microscopy sections from the lateral lumbar spinal cord regions from WT and Wlds mice harvested at day 25 after immunization depict vesicular disruption of myelin sheaths in WT mice only, despite the presence of macrophages in both samples (arrows). d: Quantification of axonal loss in anterior (A), lateral (L), and posterior (P) sections of Bielschowsky silver-stained sections from cervical (C), thoracic (T), and lumbar (L) levels of the spinal cord from mice at day 60 after immunization. Results from six to eight spinal cords per group are averaged and shown. Average EAE disease grade for WT mice used for tissue analysis at the time of tissue harvesting was 2.08 ± 0.86, whereas average score for Wlds mice used was 1.33 ± 0.75 (P = NS, Student’s t-test). Axonal loss in Wlds mice was limited to the lumbar spinal cord but was present at all levels in WT mice at much higher levels. e: Quantification of demyelination was performed using Luxol fast blue-stained sections and showed less demyelination at all levels of the spinal cord in Wlds mice. f: Demonstration of quantification method used to calculate axonal loss. Transverse sections from the posterior column (P) of the lumbar spinal cord (L) from both WT and Wlds mice were stained with the Bielschowsky method. The NIH Image analyzer program was used to calculate areas. The area with more than 50% axonal loss (outlined in green) is divided by the total white matter area of the posterior column (outlined in red), thus quantifying percent axonal loss, which is represented in d and e. There is more axonal loss in the WT sample than the Wlds sample shown. g: Demonstration of method used to quantify demyelination. Transverse sections of the posterior column (P) and lumbar spinal cord (L) are stained with Luxol fast blue. Areas with demyelination (absence of Luxol fast blue stain) (outlined in green) are divided by the total white matter area of the posterior column (outlined in red), thus measuring percent demyelination represented in e and g. There is more demyelination in the WT sample than the Wlds sample. Original magnifications: ×400 (b); ×5000 (c).
Figure 2
Figure 2
Immune responses to immunizing antigen are similar in Wlds and WT mice. a–d: Splenocytes were harvested from Wlds and WT mice 14 days after immunization with MOGp35-55 and then restimulated in vitro with MOGp35-55. a: Proliferative responses to immunizing peptide were similar in WT and Wlds mice (P = NS, Student’s t-test). b: IFN-γ production after restimulation with MOGp35-55 was similar in WT and Wlds mice (P = NS, Student’s t-test). c: IL-10 production was similar in both groups (P = NS, Student’s t-test). d: IL-5 production was similar in both groups (P = NS, Student’s t-test). e: Delayed-type hypersensitivity responses to MOGp35-55 in immunized mice were similar in WT and Wlds mice (P = NS, Student’s t-test). Results from four to six mice per group were averaged.
Figure 3
Figure 3
Reduced accumulation and activation of macrophages/microglia in the CNS in Wlds mice during EAE. a: Representative photomicrographs of spinal cord sections taken from WT and Wlds mice at days 12, 22, and 30 after immunization with MOGp35-55 and stained for Lectin-B4. Sections from WT mice show both perimeningeal/perivascular (arrowheads) and parenchymal infiltrates (white arrows) of cells from days 12 to 30. In contrast, sections from Wlds mice lack macrophage/microglia infiltrates at day 12 and have fewer parenchymal infiltrates at other time points. b: Quantification of perimeningeal and parenchymal infiltrates of CD4 T cells, CD8 T cells, and macrophage/microglia from Wlds and WT mice during the course of EAE showed that perimeningeal (P < 0.05) and parenchymal infiltrates (P < 0.05) of macrophages/microglia were significantly less in Wlds mice at day 12 after immunization. In addition, at later time points, parenchymal infiltration (d22, P < 0.05; d30, P < 0.05) of macrophages/microglia in sections from Wlds mice was significantly reduced compared with WT mice. In contrast, perimeningeal and parenchymal infiltrates of CD4 and CD8 cells were similar in both groups at all time points. Statistical analysis was performed using unpaired Student’s t-test. Original magnifications, ×20.
Figure 4
Figure 4
Increased expression of CD200 in the spinal cord of Wlds mice. Spinal cord sections from WT and Wlds mice on days 0, 22, and 60 after immunization were double-stained with CD200 (green) and NeuN (red) marker for neurons. a: Shown are representative merged confocal images. CD200 expression is markedly increased in Wlds sections compared with WT sections, with increasing expression after the induction of EAE. b and c: Splitway confocal images showing co-localization of CD200 and NeuN staining in WT (b) and Wlds (c) sections. CD200 expression is increased on Wlds neuronal bodies and processes. d: Confocal merge profiles and intensity profile shows co-localization of CD200 (green) and NeuN (red) in the surface and cytoplasm of cells and processes but not the nucleus. e: Confocal intensity profile of CD200 staining shows a punctate pattern of staining consistent with surface staining of the molecule. f: Confocal reconstruction (2.5-dimension) of Z-stacked images demonstrates punctate areas of high-intensity staining (red > yellow > green), consistent with surface staining (red), as well as medium intensity staining in cytoplasmic regions (yellow). Original magnifications, ×63.
Figure 5
Figure 5
Increased expression of CD200 during EAE co-localizes with CNPase and GFAP marker. a: Splitway confocal images show partial co-localization of CD200 and CNPase markers in Wlds and WT spinal cord sections. Expression in both strains is enhanced at day 22 after immunization compared with naïve spinal cords. b: Splitway confocal images show partial co-localization of CD200 and GFAP markers in Wlds and WT spinal cord sections. Expression is enhanced particularly in Wlds sections at day 22 after immunization compared with naïve spinal cords. Original magnifications, ×63.
Figure 6
Figure 6
Decreased ubiquitination of CD200 in spinal cord lysates of Wlds mice. a: Representative immunoblot of spinal cord lysates from naïve WT mice (lanes 1 and 2), naïve Wlds mice (lanes 3 and 4), WT mice day 22 after immunization (lanes 5 and 6), Wlds mice day 22 after immunization (lanes 7 and 8), WT mice day 60 after immunization (lanes 9 and 10), and Wlds mice day 60 after immunization (lanes 11 and 12) shows increased expression of CD200 in Wlds spinal cord lysates at all time points from compared with those from WT mice. β-Actin control immunoblot shows similar protein amounts in all samples. b: Densitometric quantification of immunoblots demonstrates increased expression of CD200 during the course of EAE in Wlds mice but not WT mice. c: Immunoprecipitation of CD200, with immunoblotting (IB) of ubiquitin and CD200. Sample numbers are the same as in a, except sample 10 was omitted. There was decreased expression ubiquitination of CD200 in Wlds mice samples at d0 and d22 compared with WT samples. At d60, the expression of ubiquitin was increased in Wlds samples and was comparable with the WT sample.
Figure 7
Figure 7
CD200R expression in Wlds and WT splenocytes and CNS. CD200R expression was assessed by flow cytometry in WT and Wlds splenocyte populations on day 0 (a) and at day 15 (b) after immunization. CD200R was predominantly found on naïve CD11b+ and CD11c+ cells in both strains with no significant difference between the WT and Wlds strains. Expression of CD200R decreased after immunization on these cells. c: Protein levels were assessed in spinal cord lysates from WT and Wlds mice on day 0 and day 15 after immunization, by Western blot, and expressed as protein/β-actin IDV values. There was no significant difference in CD200R expression between the strains. IL-6 was reduced and IL-10 was elevated in Wlds mice compared with WT mice after immunization at day 15 after immunization. There was no significant difference in tumor necrosis factor-α, TLR-4, or CD22 expression between the two strains at either time point. d: Fractalkine (CX3CL1) concentration in spinal cord homogenates from WT and Wlds at day 0 and day 14 after immunization was assessed using ELISA assay. Results from four mice/group/time point were averaged. There was no significant difference between WT and Wlds mice at either time point.
Figure 8
Figure 8
CD200R is expressed on microglia, oligodendrocytes, and astrocytes. Spinal cord sections from WT and Wlds mice on days 0, 22, and 60 after immunization were double-stained with CD200R (red) and LB4-microglial or GFAP (astrocytes) or CNPase (oligodendrocytes) or β-tubulin (axons and neurons). Shown are representative merged confocal images from mice on day 22 after immunization. CD200R staining was present on microglia/macrophages as well as astrocytes and oligodendrocytes from both strains. CD200R was not present on axons/neurons. Original magnifications, ×63.
Figure 9
Figure 9
Treatment of Wlds mice with blocking anti-CD200 antibody results in worsened EAE with increased macrophage/microglia infiltrates in the CNS. After the induction of EAE, Wlds and WT mice were treated with 200 μg/100 μl of blocking anti-CD200 antibody injected intravenously every other day from days 10 to 20. Control WT and Wlds mice were treated with PBS alone. Eight mice per treatment group were evaluated. a: Wlds mice treated with anti-CD200 antibody experienced a more severe disease course than untreated Wlds mice (P < 0.05, Student’s t-test—area under the curve). In comparison, disease in WT mice was similar even after treatment with anti-CD200 antibody (P = NS, Student’s t-test). b: Spinal cord sections harvested at day 20 from treated and control mice demonstrate enhanced immunofluorescence staining of macrophages/microglia (white arrows) in the CNS of anti-CD200-treated Wlds mice compared with Wlds controls. Macrophage/microglia staining was similar in treated and untreated WT mice. Immunofluorescence staining demonstrates more SMI-32-positive axonal ovoids (white arrows) in the spinal cord white matter of treated Wlds mice, compared with untreated controls. c and d: We performed flow cytometric analysis of immune cell populations in the spinal cords isolated from WT and Wlds mice treated with anti-CD200 antibody or rat IgG control antibody (days 10 to 20) on day 20 after immunization. The results from three to four mice per group were averaged and are shown in table form in d. Also shown is a representative FACS analysis of spinal cords from WT and Wlds mice treated with control Ig or anti-CD200 antibody and stained with CD11b-phycoerythrin and CD45-allophycocyanine (APC) antibodies (c). Original magnifications, ×10.
Figure 10
Figure 10
Neuronal cultures from Wlds E16 embryos are protected from LPS-activated microglial-induced toxicity. Cortical neuronal cultures were derived from WT and Wlds E16 embryos and plated at a high-density concentration of 200,000 cells/well/0.5 ml in 24-well plates. a: Representative fluorescence microscopy photomicrographs of MAP-2 (red), CD200 (green), and merged images from cortical cultures. CD200 expression is increased in Wlds cultures compared with WT cultures, and co-localizes with MAP-2-positive cells (white arrows). In some cases, CD200 expression does not co-localize with MAP-2 (arrowheads). Controls are stained with isotype control antibody and secondary antibodies. b and c: Shown are representative photomicrographs of WT and Wlds neuronal cultures with LPS-activated (b) or IFN-γ-activated (c) primary microglia. Cultures were immunostained with anti-MAP-2 antibody (red) and LB4 (green). Wlds axons and neurons remain intact after co-culture with activated microglia; however, there is significant increase in axonal beading in WT co-cultures. Percentage of beaded axons/total number of axons in 10 fields was quantified for each condition. Protection of Wlds neurons from neurotoxicity induced by activated microglia is ameliorated after the addition of a blocking anti-CD200 antibody or anti-CD200 F(Ab′)2 fragment (both conditions, P < 0.0001; Student’s t-test). Original magnifications, ×40 (a); ×63 (b, c).

References

    1. Trapp BD, Peterson J, Ransohoff RM, Rudick R, Mork S, Bo L. Axonal transection in the lesions of multiple sclerosis. N Engl J Med. 1998;338:278–285. - PubMed
    1. Brown A, McFarlin DE, Raine CS. Chronologic neuropathology of relapsing experimental allergic encephalomyelitis in the mouse. Lab Invest. 1982;46:171–185. - PubMed
    1. Lunn ER, Perry VH, Brown MC, Rosen H, Gordon S. Absence of Wallerian degeneration does not hinder regeneration in peripheral nerve. Eur J Neurosci. 1989;1:27–33. - PubMed
    1. Mack TG, Reiner M, Beirowski B, Mi W, Emanuelli M, Wagner D, Thomson D, Gillingwater T, Court F, Conforti L, Fernando FS, Tarlton A, Andressen C, Addicks K, Magni G, Ribchester RR, Perry VH, Coleman MP. Wallerian degeneration of injured axons and synapses is delayed by a Ube4b/Nmnat chimeric gene. Nat Neurosci. 2001;4:1199–1206. - PubMed
    1. Perry VH, Brown MC, Lunn ER. Very slow retrograde and Wallerian degeneration in the CNS of C57BL/Ola mice. Eur J Neurosci. 1991;3:102–105. - PubMed

Publication types

MeSH terms