. 2007 May;170(5):1781-92.
doi: 10.2353/ajpath.2007.060886.

The host inflammatory response promotes liver metastasis by increasing tumor cell arrest and extravasation

Affiliations

The host inflammatory response promotes liver metastasis by increasing tumor cell arrest and extravasation

Patrick Auguste et al. Am J Pathol. 2007 May.

Abstract

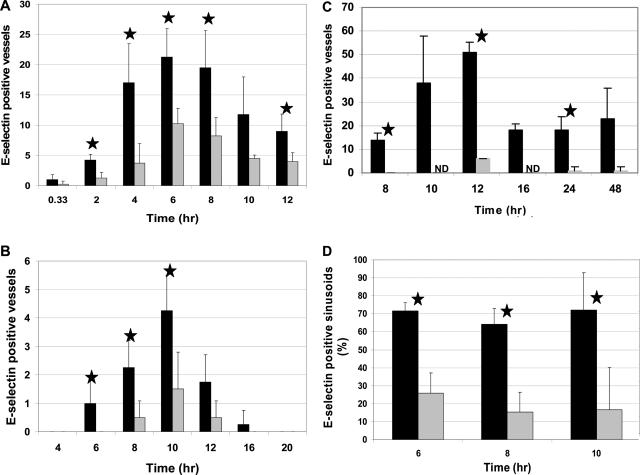
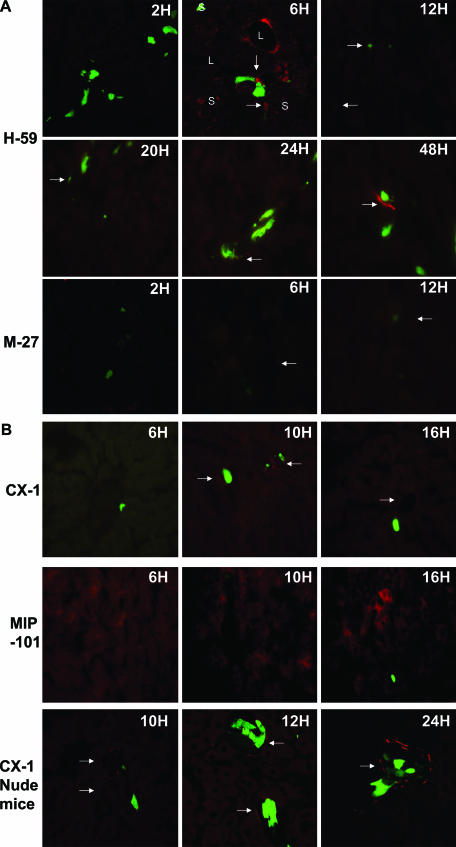
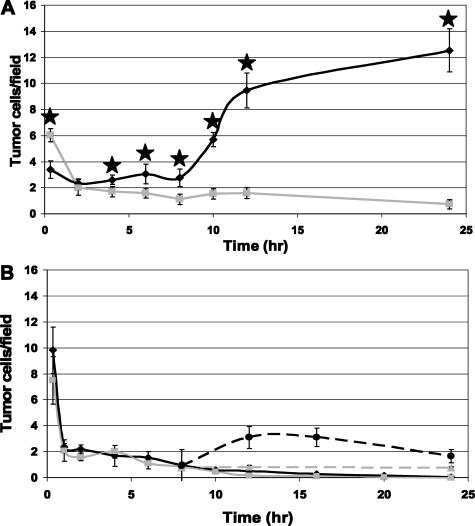
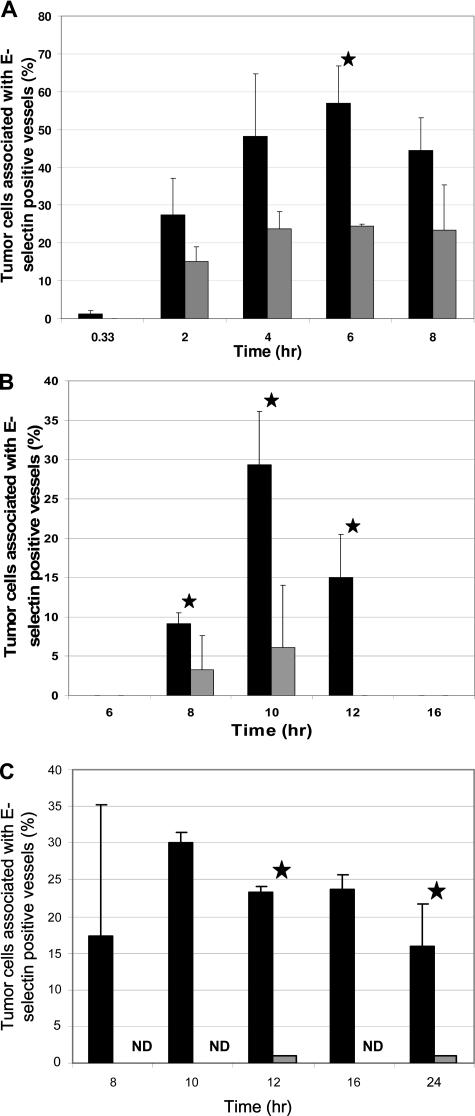
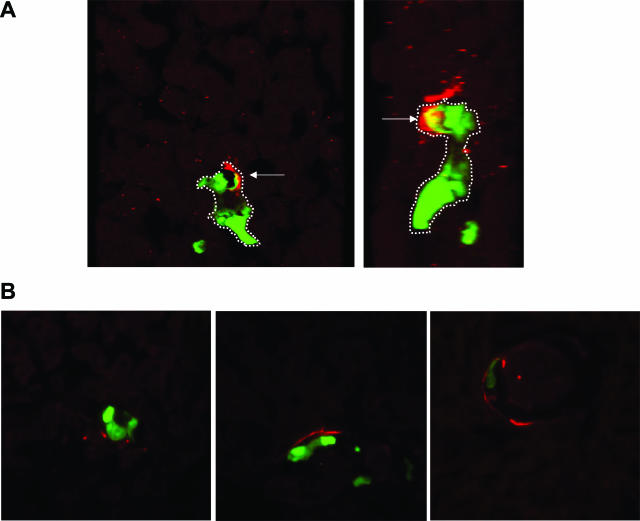
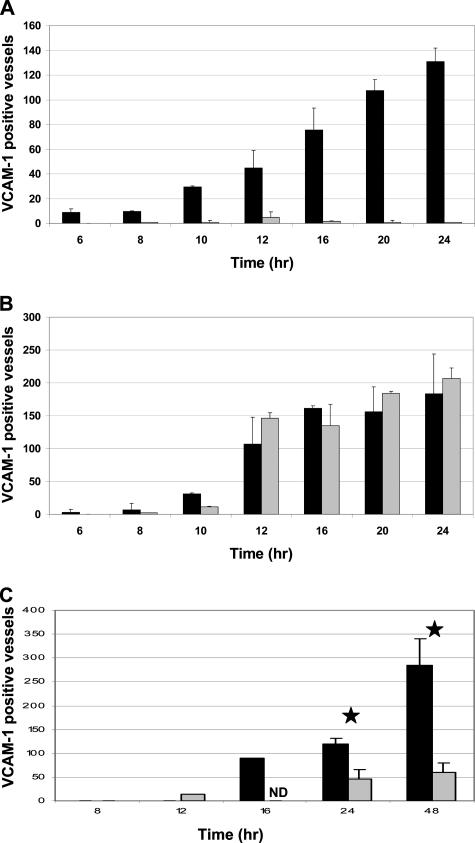
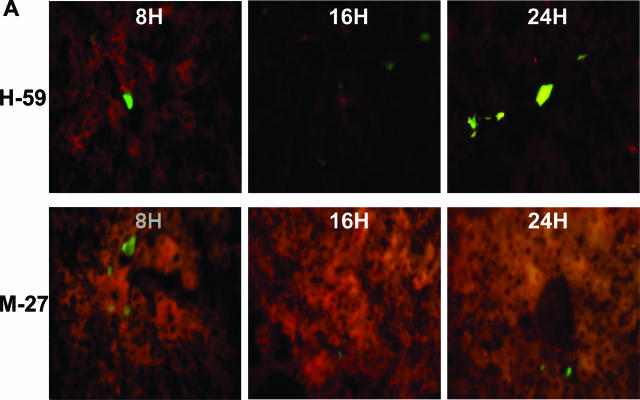
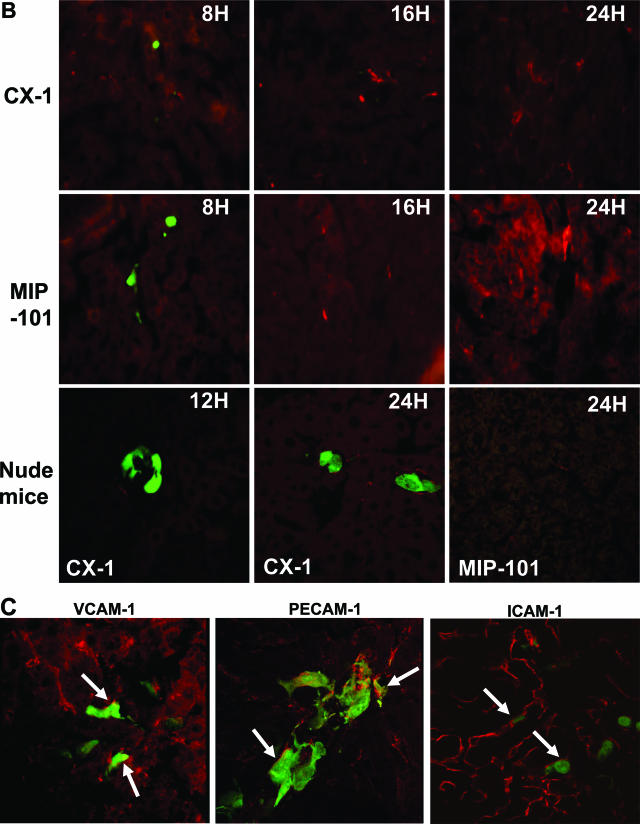
Inflammation can play a regulatory role in cancer progression and metastasis. Previously, we have shown that metastatic tumor cells entering the liver trigger a proinflammatory response involving Kupffer cell-mediated release of tumor necrosis factor-alpha and the up-regulation of vascular endothelial cell adhesion receptors, such as E-selectin. Here, we analyzed spatio-temporal aspects of the ensuing tumor-endothelial cell interaction using human colorectal carcinoma CX-1 and murine carcinoma H-59 cells and a combination of immunohistochemistry, confocal microscopy, and three-dimensional reconstruction. E-selectin expression was evident mainly on sinusoidal vessels by 6 and 10 hours, respectively, following H-59 and CX-1 inoculation, and this corresponded to a stabilization of the number of tumor cells within the sinuses. Tumor cells arrested in E-selectin(+) vessels and appeared to flatten and traverse the vessel lining, away from sites of intense E-selectin staining. This process was evident by 8 (H-59) and 12 (CX-1) hours after inoculation, coincided with increased endothelial vascular cell adhesion molecule-1 expression, and involved tumor cell attachment in areas of intense vascular cell adhesion molecule-1 and platelet endothelial cell adhesion molecule-1 expression. Nonmetastatic (human) MIP-101 and (murine) M-27 cells induced a weaker response and could not be seen to extravasate. The results show that metastatic tumor cells can alter the hepatic microvasculature and use newly expressed endothelial cell receptors to arrest and extravasate.


Figures

Figure 1
Figure 1
Rapid increase in E-selectin expression in response to tumor cell injections. Cryostat sections were prepared from livers removed at different time intervals following the inoculation of H-59 and M-27 (A, H-59: black bars; M-27: gray) or CX-1 and MIP-101 (B and C, CX-1: black; MIP-101: gray) cells into C57Bl/6 mice (A and B) or nude mice (C). Sections were stained with an E-selectin-specific antibody and an Alexa Fluor 568 secondary antibody. E-selectin-positive vessels were counted at ×630 magnification in 20 fields per liver using a total of four livers per time point. Results are expressed as the mean number (±SD) of E-selectin-positive vessels counted in 20 microscope fields/time point. Shown in D are the proportions (%) of E-selectin+ sinusoids as calculated for mice inoculated with H-59 (black) or M-27 (gray) cells. P < 0.05 (t-test) for H-59 (A and D) and CX-1 (B and C) cells compared with M-27 and MIP-101 cells, respectively.
Figure 2
Figure 2
Localization of tumor cells in E-selectin-positive vessels. Shown are images of E-selectin+ vessels (arrows) captured at different time intervals following the inoculation of H-59 and M-27 (A) or CX-1 and MIP-101 (B) cells. Tumor cells are in green. S, sinusoidal vessel; L, centrolobular or portal venules. Original magnification, ×400.
Figure 3
Figure 3
Tracking of tumor cells in vivo reveals no differences in tumor cell distribution following injection. Cryostat sections were prepared from livers removed at different intervals following the inoculation of H-59 (black line in A), M-27 (gray line in A), CX-1 (black diamonds and circles in B), or MIP-101 (gray squares or triangles in B) into C57Bl/6 (A and solid lines in B) or nude (dashed lines in B) mice. Fluorescent tumor cells were counted in 20 fields/slide in sections prepared from each of four different livers. Results are expressed as the mean number of cells (±SD) counted per field at a magnification of ×630. There was a significant difference between the numbers of H-59 and M-27 cells counted (A) at all time points >2 hours (P < 0.05). There was no significant difference between the numbers of CX-1 and MIP-101 cells observed following the injection into C57Bl/6 or nude mice. The numbers of CX-1 cells observed in livers derived from nude mice were significantly higher than those seen in livers from C57Bl/6 mice (P < 0.05) at 12 and 24 hours.
Figure 4
Figure 4
Time-dependent increase in tumor cell association with E-selectin+ vessels. Cryostat sections were prepared from livers removed at different time intervals following the inoculation of H-59 and M-27 (A, H-59: black; M-27: gray) or CX-1 and MIP-101 into C57B1/6 (B, CX-1: black; MIP-101: gray) or nude (C, CX-1: black; MIP-101: gray) mice. Sections were stained with E-selectin-specific antibody and an Alexa Fluor 568 secondary antibody. Tumor cells associated (or not) with E-selectin-positive vessels were counted in 20 different fields per liver (n = 4) at a magnification of ×630. Results are expressed as the mean percentage of tumor cells per field that were associated with E-selectin-positive vessels. P < 0.05 (t-test) for H-59 (A) and CX-1 (B and C) cells as compared with M-27 and MIP-101 cells, respectively. ND, not determined.
Figure 5
Figure 5
Confocal microscopy reveals close contact between tumor cells and E-selectin. Cryostat sections were prepared from livers removed at different time intervals following the inoculation of H-59 (A) or CX-1 (B) cells and immunostained with anti E-selectin antibodies. Sections were analyzed with a Zeiss confocal microscope at a magnification of ×630, and 3D reconstruction was performed using the MetaMorph software. Tumor cells are shown in green. Arrows (A) on the 3D reconstructed images of red and green fluorescence indicate co-localized tumor cell/E-selectin signals, demonstrating areas of contact. The transmigrating cell is outlined by the dashed line. The right image in A is an enlarged and rotated (255°) version of the left image. Cell spreading along E-selectin+ vessels is shown in A and B.
Figure 6
Figure 6
VCAM-1 expression increases in response to tumor cell injection. Cryostat sections prepared following the inoculation of H-59 and M-27 (A, H-59: black; M-27: gray) or CX-1 and MIP-101 cells into C57B1/6 (B, CX-1: black; MIP-101: gray) or nude (C, CX-1: black; MIP-101: gray) mice were used for quantification of VCAM-1+ vessels. Sections were stained with anti-VCAM-1 antibodies and an Alexa Fluor 568 secondary antibody. VCAM-1-positive vessels were enumerated in 20 fields per liver at a magnification of ×630. Results are expressed as the mean number of VCAM-1-positive vessels (±SD, n = 4) in 20 microscope fields per time point. The difference between animals injected with H-59 and M-27 cells (A) was significant (P < 0.05) at all time points from 10 hours onward. P < 0.05.
Figure 7
Figure 7
Confocal microscopy reveals areas of contact between H-59 and vascular endothelial CAM. Shown are representative images of VCAM-1+ vessels observed following injection of H-59 and M-27 (A) or CX-1 and MIP-101 (B) cells. Tumor cells are in green. Magnification, ×400. Shown in C are representative images captured with 100-μm liver sections that were obtained following inoculation of H-59 cells and stained with antibodies to VCAM-1, PECAM-1, or ICAM-1, as indicated. A Zeiss confocal microscope was used for the analysis at magnifications of ×630 (VCAM-1 and PECAM-1) or ×400 (ICAM-1). Cells are in green. Arrows on the merged images of red and green fluorescence indicate co-localized tumor cell/CAM signals.
Figure 7
Figure 7
Confocal microscopy reveals areas of contact between H-59 and vascular endothelial CAM. Shown are representative images of VCAM-1+ vessels observed following injection of H-59 and M-27 (A) or CX-1 and MIP-101 (B) cells. Tumor cells are in green. Magnification, ×400. Shown in C are representative images captured with 100-μm liver sections that were obtained following inoculation of H-59 cells and stained with antibodies to VCAM-1, PECAM-1, or ICAM-1, as indicated. A Zeiss confocal microscope was used for the analysis at magnifications of ×630 (VCAM-1 and PECAM-1) or ×400 (ICAM-1). Cells are in green. Arrows on the merged images of red and green fluorescence indicate co-localized tumor cell/CAM signals.

References

    1. Bissell MJ, Kenny PA, Radisky DC. Microenvironmental regulators of tissue structure and function also regulate tumor induction and progression: the role of extracellular matrix and its degrading enzymes. Cold Spring Harb Symp Quant Biol. 2005;70:343–356. - PMC - PubMed
    1. Witz IP, Levy-Nissenbaum O. The tumor microenvironment in the post-PAGET era. Cancer Lett. 2006;242:1–10. - PubMed
    1. Coussens LM, Werb Z. Inflammation and cancer. Nature. 2002;420:860–867. - PMC - PubMed
    1. Robinson SC, Coussens LM. Soluble mediators of inflammation during tumor development. Adv Cancer Res. 2005;93:159–187. - PubMed
    1. Fahy B, Bold RJ. Epidemiology and molecular genetics of colorectal cancer. Surg Oncol. 1998;7:115–123. - PubMed

Publication types