

Computation of flow through the oesophagogastric junction
- PMID: 17457966
- PMCID: PMC4146919
- DOI: 10.3748/wjg.v13.i9.1360
Computation of flow through the oesophagogastric junction
Abstract
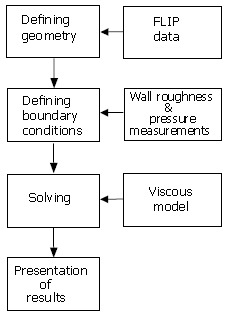
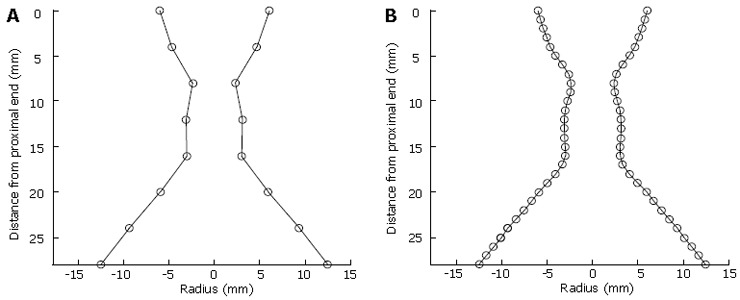
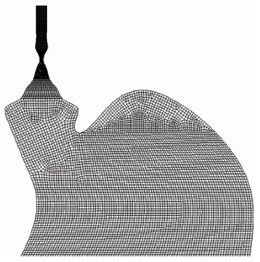
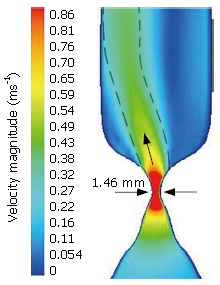
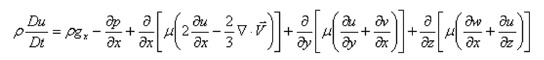
Whilst methods exist to indirectly measure the effects of increased flow or gastro-oesophageal refluxing, they cannot quantitatively measure the amount of acid travelling back up into the oesophagus during reflux, nor can they indicate the flow rate through the oesophago-gastric junction (OGJ). Since OGJ dysfunction affects flow it seems most appropriate to describe the geometry of the OGJ and its effect on the flow. A device known as the functional lumen imaging probe (FLIP) has been shown to reliably measure the geometry of and pressure changes in the OGJ. FLIP cannot directly measure flow but the data gathered from the probe can be used to model flow through the junction by using computational flow dynamics (CFD). CFD uses a set of equations known as the Navier-Stokes equations to predict flow patterns and is a technique widely used in engineering. These equations are complex and require appropriate assumptions to provide simplifications before useful data can be obtained. With the assumption that the cross-sectional areas obtained via FLIP are circular, the radii of these circles can be obtained. A cubic interpolation scheme can then be applied to give a high-resolution geometry for the OGJ. In the case of modelling a reflux scenario, it can be seen that at the narrowest section a jet of fluid squirts into the oesophagus at a higher velocity than the fluid surrounding it. This jet has a maximum velocity of almost 2 ms(-1) that occurs where the OGJ is at its narrowest. This simple prediction of acid 'squirting' into the oesophagus illustrates how the use of numerical methods can be used to develop a better understanding of the OGJ. This initial work using CFD shows some considerable promise for the future.
Figures
Similar articles
-
Do we really understand the role of the oesophagogastric junction in disease?World J Gastroenterol. 2009 Jan 14;15(2):144-50. doi: 10.3748/wjg.15.144. World J Gastroenterol. 2009. PMID: 19132763 Free PMC article. Review.
-
Functional oesophago-gastric junction imaging.World J Gastroenterol. 2006 May 14;12(18):2818-24. doi: 10.3748/wjg.v12.i18.2818. World J Gastroenterol. 2006. PMID: 16718804 Free PMC article. Review.
-
A new technique for evaluating sphincter function in visceral organs: application of the functional lumen imaging probe (FLIP) for the evaluation of the oesophago-gastric junction.Physiol Meas. 2005 Oct;26(5):823-36. doi: 10.1088/0967-3334/26/5/019. Epub 2005 Jul 22. Physiol Meas. 2005. PMID: 16088071
-
Long-term effect of fundoplication on motility of the oesophagus and oesophagogastric junction.Br J Surg. 2004 Nov;91(11):1466-72. doi: 10.1002/bjs.4759. Br J Surg. 2004. PMID: 15386318
-
Oesophago-gastric junction opening function: assessment using ultrasound imaging and the effects of atropine.Neurogastroenterol Motil. 2006 May;18(5):376-84. doi: 10.1111/j.1365-2982.2006.00763.x. Neurogastroenterol Motil. 2006. PMID: 16629865
Cited by
-
Microdissection of Human Esophagogastric Junction Wall with Phase-contrast X-ray CT Imaging.Sci Rep. 2015 Sep 8;5:13831. doi: 10.1038/srep13831. Sci Rep. 2015. PMID: 26346099 Free PMC article.
-
Modeling the fluid dynamics in a human stomach to gain insight of food digestion.J Food Sci. 2010 Sep;75(7):R151-62. doi: 10.1111/j.1750-3841.2010.01748.x. J Food Sci. 2010. PMID: 21535567 Free PMC article. Review.
-
Biology and medicine in the landscape of quantum advantages.J R Soc Interface. 2022 Nov;19(196):20220541. doi: 10.1098/rsif.2022.0541. Epub 2022 Nov 30. J R Soc Interface. 2022. PMID: 36448288 Free PMC article. Review.
-
What Is the Future of Impedance Planimetry in Gastroenterology?J Neurogastroenterol Motil. 2018 Apr 30;24(2):166-181. doi: 10.5056/jnm18013. J Neurogastroenterol Motil. 2018. PMID: 29605974 Free PMC article. Review.
-
Gastrointestinal tract modelling in health and disease.World J Gastroenterol. 2009 Jan 14;15(2):169-76. doi: 10.3748/wjg.15.169. World J Gastroenterol. 2009. PMID: 19132766 Free PMC article. Review.
References
-
- Gregersen H. The Giome project. Neurogastroenterol Motil. 2006;18:401–402. - PubMed
-
- McMahon BP, Frøkjaer JB, Kunwald P, Liao D, Funch-Jensen P, Drewes AM, Gregersen H. The functional lumen imaging probe (FLIP) for evaluation of the esophagogastric junction. Am J Physiol Gastrointest Liver Physiol. 2007;292:G377–G384. - PubMed
-
- McMahon BP, Frøkjaer JB, Liao D, Kunwald P, Drewes AM, Gregersen H. A new technique for evaluating sphincter function in visceral organs: application of the functional lumen imaging probe (FLIP) for the evaluation of the oesophago-gastric junction. Physiol Meas. 2005;26:823–836. - PubMed
Publication types
MeSH terms
LinkOut - more resources
Full Text Sources
Miscellaneous
