

Anatomically realistic multiscale models of normal and abnormal gastrointestinal electrical activity
- PMID: 17457969
- PMCID: PMC4146922
- DOI: 10.3748/wjg.v13.i9.1378
Anatomically realistic multiscale models of normal and abnormal gastrointestinal electrical activity
Abstract
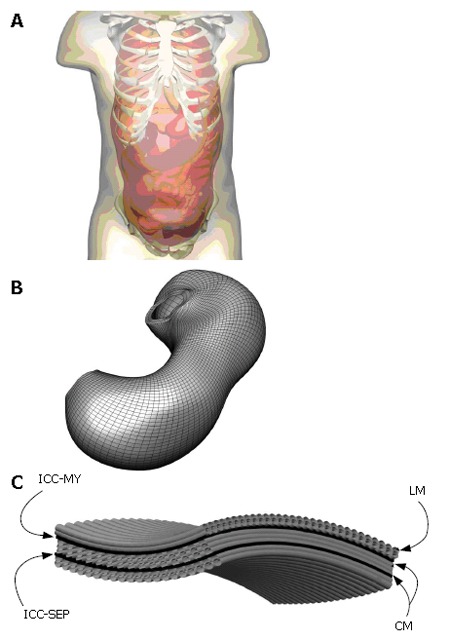
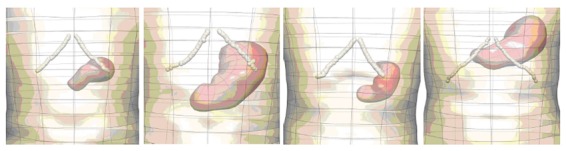
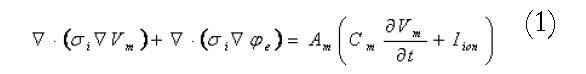
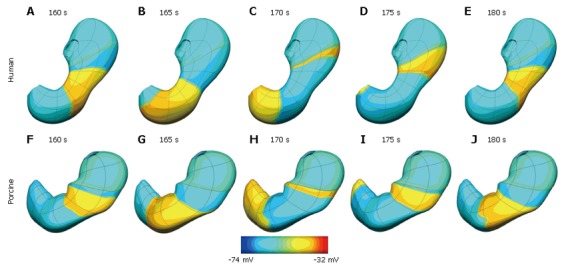
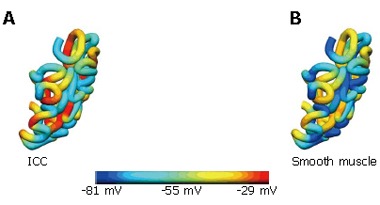
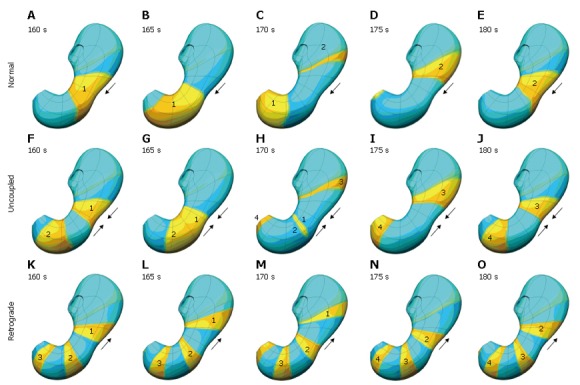
One of the major aims of the International Union of Physiological Sciences (IUPS) Physiome Project is to develop multiscale mathematical and computer models that can be used to help understand human health. We present here a small facet of this broad plan that applies to the gastrointestinal system. Specifically, we present an anatomically and physiologically based modelling framework that is capable of simulating normal and pathological electrical activity within the stomach and small intestine. The continuum models used within this framework have been created using anatomical information derived from common medical imaging modalities and data from the Visible Human Project. These models explicitly incorporate the various smooth muscle layers and networks of interstitial cells of Cajal (ICC) that are known to exist within the walls of the stomach and small bowel. Electrical activity within individual ICCs and smooth muscle cells is simulated using a previously published simplified representation of the cell level electrical activity. This simulated cell level activity is incorporated into a bidomain representation of the tissue, allowing electrical activity of the entire stomach or intestine to be simulated in the anatomically derived models. This electrical modelling framework successfully replicates many of the qualitative features of the slow wave activity within the stomach and intestine and has also been used to investigate activity associated with functional uncoupling of the stomach.
Figures


References
-
- Pullan AJ, Buist ML, Cheng LK. Mathematically Modelling the Electrical Activity of the Heart: From Cell to Body Surface and Back Again. New Jersey: World Scientific; 2005.
-
- Pullan A, Cheng L, Yassi R, Buist M. Modelling gastrointestinal bioelectric activity. Prog Biophys Mol Biol. 2004;85:523–550. - PubMed
-
- Buist ML, Cheng LK, Yassi R, Bradshaw LA, Richards WO, Pullan AJ. An anatomical model of the gastric system for producing bioelectric and biomagnetic fields. Physiol Meas. 2004;25:849–861. - PubMed
-
- Lin AS, Buist ML, Cheng LK, Smith NP, Pullan AJ. Computational simulations of the human magneto- and electroenterogram. Ann Biomed Eng. 2006;34:1322–1331. - PubMed
-
- Liang J, Chen JD. What can be measured from surface electrogastrography. Computer simulations. Dig Dis Sci. 1997;42:1331–1343. - PubMed
Publication types
MeSH terms
Grants and funding
LinkOut - more resources
Full Text Sources
Other Literature Sources
