

Reaction mechanisms of 15-hydroperoxyeicosatetraenoic acid catalyzed by human prostacyclin and thromboxane synthases
- PMID: 17459323
- PMCID: PMC2041921
- DOI: 10.1016/j.abb.2007.03.012
Reaction mechanisms of 15-hydroperoxyeicosatetraenoic acid catalyzed by human prostacyclin and thromboxane synthases
Abstract
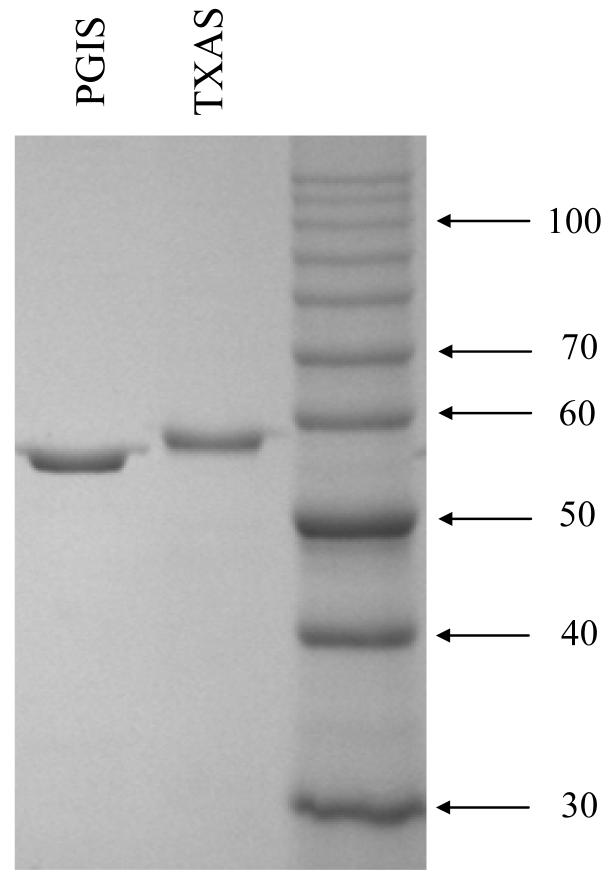
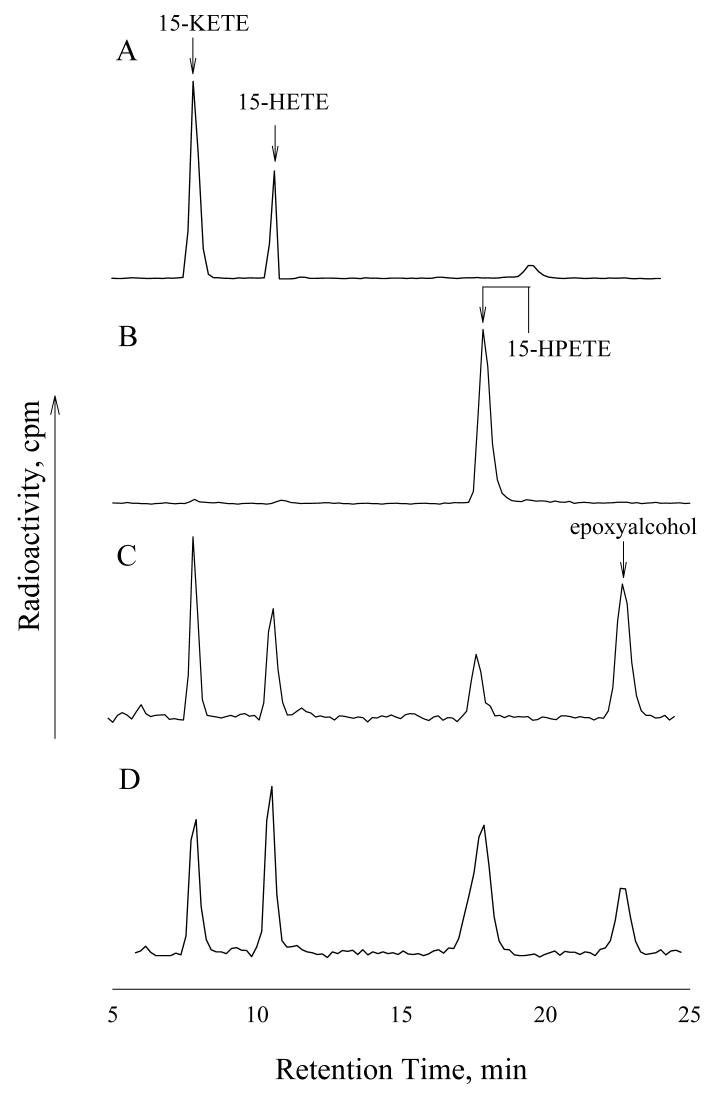
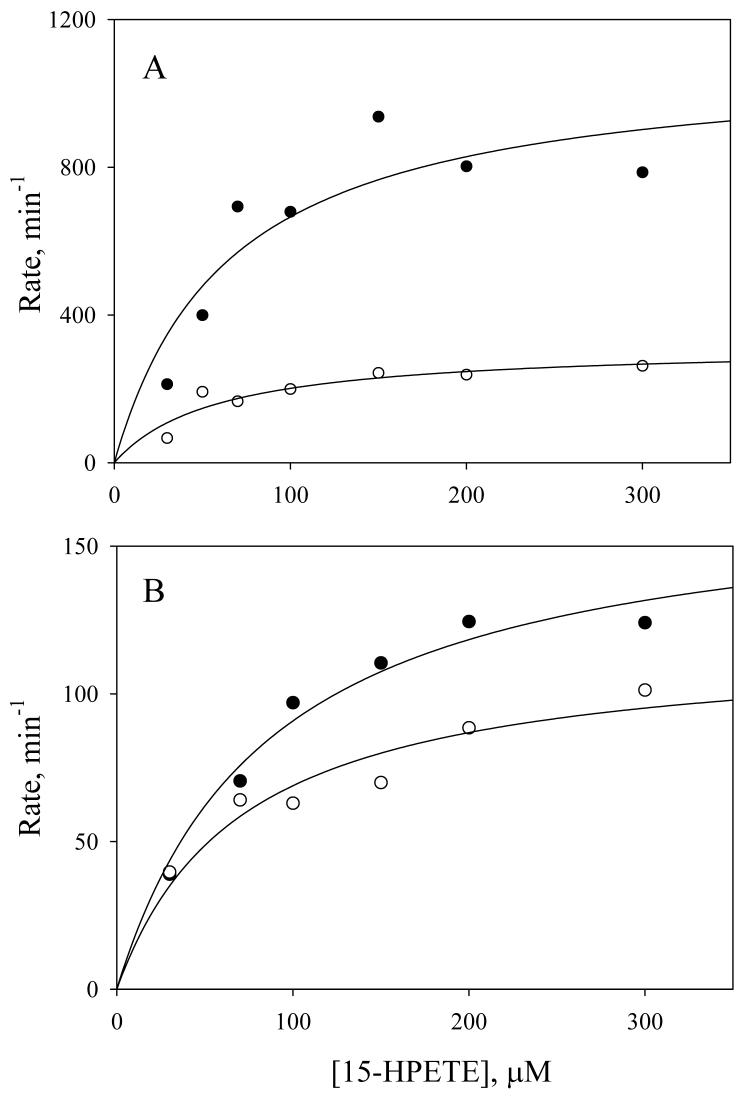
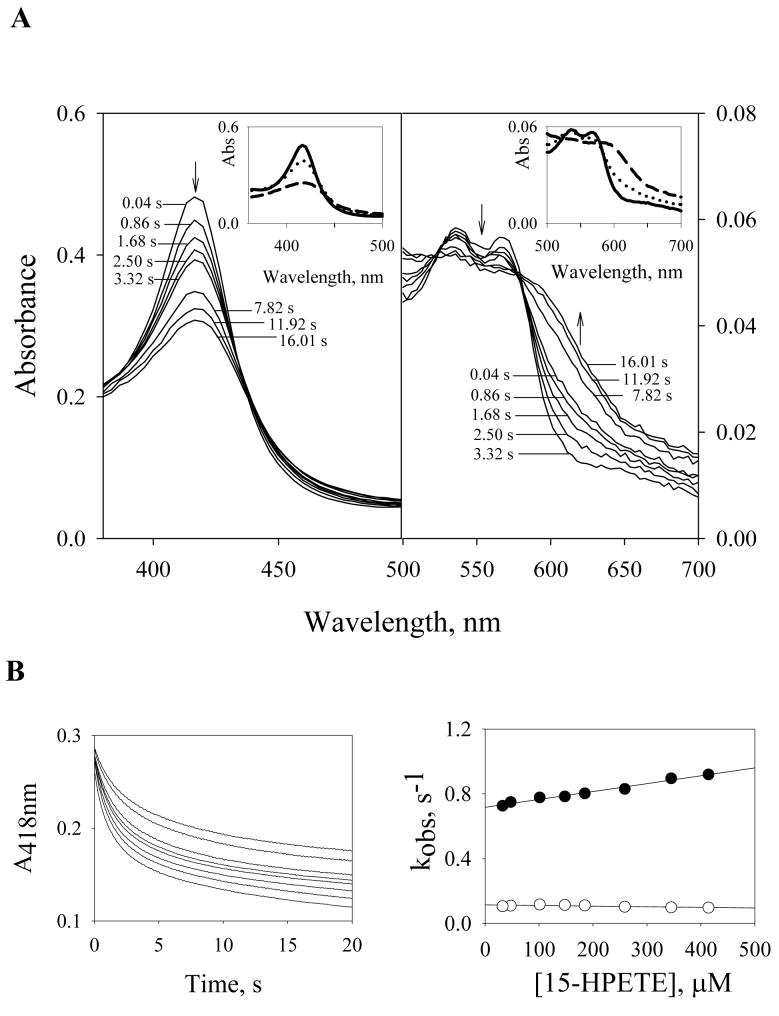
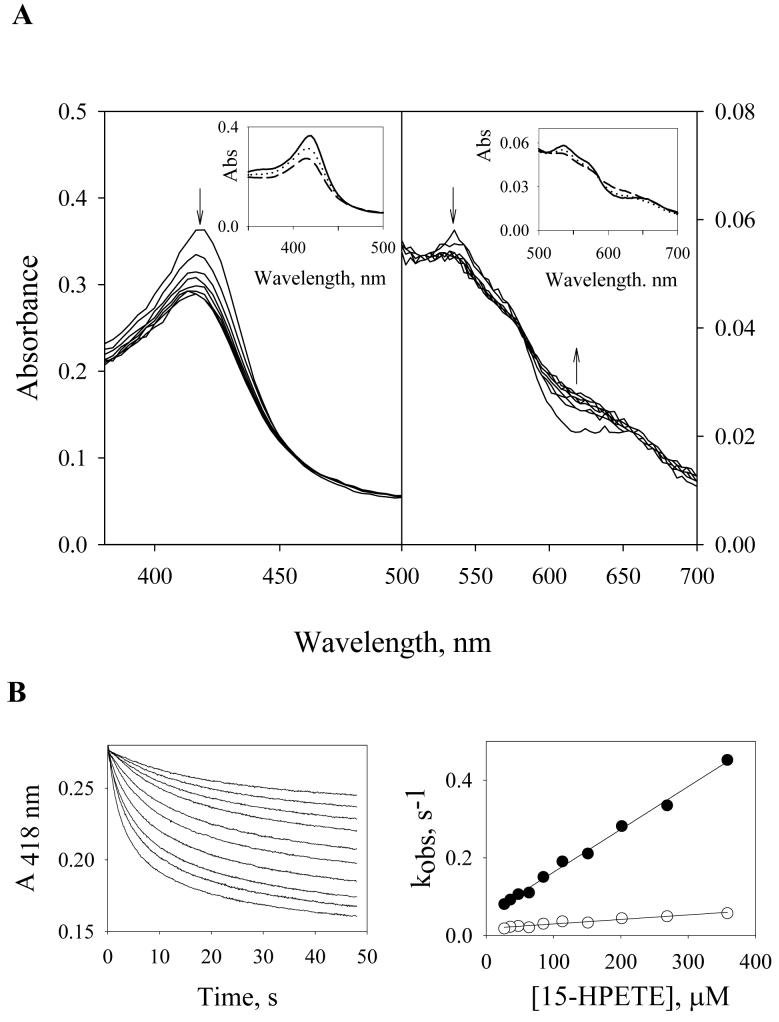
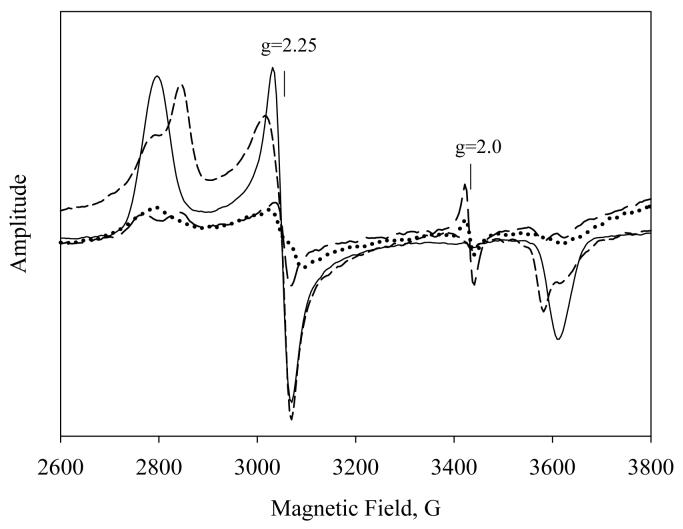
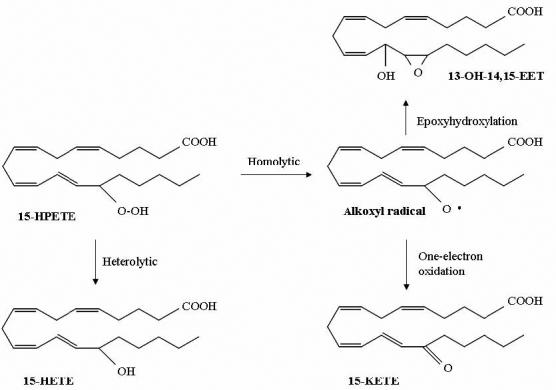
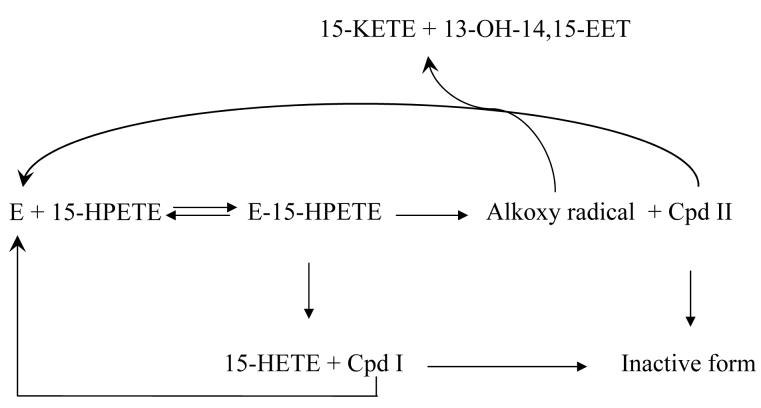
Prostacyclin synthase (PGIS) and thromboxane synthase (TXAS) are atypical cytochrome P450s. They do not require NADPH or dioxygen for isomerization of prostaglandin H(2) (PGH(2)) to produce prostacyclin (PGI(2)) and thromboxane A(2) (TXA(2)). PGI(2) and TXA(2) have opposing actions on platelet aggregation and blood vessel tone. In this report, we use a lipid hydroperoxide, 15-hydroperoxyeicosatetraenoic acid (15-HPETE), to explore the active site characteristics of PGIS and TXAS. The two enzymes transformed 15-HPETE not only into 13-hydroxy-14,15-epoxy-5,8,11-eicosatrienoic acid (13-OH-14,15-EET), like many microsomal P450s, but also to 15-ketoeicosatetraenoic acid (15-KETE) and 15-hydroxyeicosatetraenoic acid (15-HETE). 13-OH-14,15-EET and 15-KETE result from homolytic cleavage of the O-O bond, whereas 15-HETE results from heterolytic cleavage, a common peroxidase pathway. About 80% of 15-HPETE was homolytically cleaved by PGIS and 60% was homolytically cleaved by TXAS. The V(max) of homolytic cleavage is 3.5-fold faster than heterolytic cleavage for PGIS-catalyzed reactions (1100 min(-1)vs. 320 min(-1)) and 1.4-fold faster for TXAS (170 min(-1)vs. 120 min(-1)). Similar K(M) values for homolytic and heterolytic cleavages were found for PGIS ( approximately 60 microM 15-HPETE) and TXAS ( approximately 80 microM 15-HPETE), making PGIS a more efficient catalyst for the 15-HPETE reaction.
Figures
Similar articles
-
The N-terminal membrane anchor domain of the membrane-bound prostacyclin synthase involved in the substrate presentation of the coupling reaction with cyclooxygenase.Arch Biochem Biophys. 2005 Mar 15;435(2):372-81. doi: 10.1016/j.abb.2004.12.018. Arch Biochem Biophys. 2005. PMID: 15708381
-
Characterization of heme environment and mechanism of peroxide bond cleavage in human prostacyclin synthase.Biochim Biophys Acta. 2005 Dec 30;1738(1-3):121-32. doi: 10.1016/j.bbalip.2005.11.007. Epub 2005 Dec 20. Biochim Biophys Acta. 2005. PMID: 16406803 Free PMC article.
-
Expression of thromboxane synthase, prostacyclin synthase and thromboxane receptor in atherosclerotic lesions: correlation with plaque composition.Atherosclerosis. 2010 Feb;208(2):376-81. doi: 10.1016/j.atherosclerosis.2009.08.008. Epub 2009 Aug 13. Atherosclerosis. 2010. PMID: 19735918
-
Role of prostacyclin synthase in carcinogenesis.Prostaglandins Other Lipid Mediat. 2017 Nov;133:49-52. doi: 10.1016/j.prostaglandins.2017.05.001. Epub 2017 May 12. Prostaglandins Other Lipid Mediat. 2017. PMID: 28506876 Review.
-
Human prostacyclin and thromboxane synthases: Molecular interactions, regulation, and pharmacology.Biochimie. 2025 Jul;234:76-88. doi: 10.1016/j.biochi.2025.04.003. Epub 2025 Apr 11. Biochimie. 2025. PMID: 40222477 Review.
Cited by
-
Spectroscopic characterization of the oxyferrous complex of prostacyclin synthase in solution and in trapped sol-gel matrix.FEBS J. 2008 May;275(9):2305-14. doi: 10.1111/j.1742-4658.2008.06385.x. Epub 2008 Apr 3. FEBS J. 2008. PMID: 18397321 Free PMC article.
-
Functional analysis of human thromboxane synthase polymorphic variants.Pharmacogenet Genomics. 2012 Sep;22(9):653-8. doi: 10.1097/FPC.0b013e3283562d82. Pharmacogenet Genomics. 2012. PMID: 22735388 Free PMC article.
-
Functional characterization of human cytochrome P450 2S1 using a synthetic gene-expressed protein in Escherichia coli.Mol Pharmacol. 2009 Nov;76(5):1031-43. doi: 10.1124/mol.109.057752. Epub 2009 Aug 27. Mol Pharmacol. 2009. PMID: 19713358 Free PMC article.
-
Human cytochrome P450 enzymes 5-51 as targets of drugs and natural and environmental compounds: mechanisms, induction, and inhibition - toxic effects and benefits.Drug Metab Rev. 2018 Aug;50(3):256-342. doi: 10.1080/03602532.2018.1483401. Drug Metab Rev. 2018. PMID: 30717606 Free PMC article. Review.
-
Structures of prostacyclin synthase and its complexes with substrate analog and inhibitor reveal a ligand-specific heme conformation change.J Biol Chem. 2008 Feb 1;283(5):2917-26. doi: 10.1074/jbc.M707470200. Epub 2007 Nov 21. J Biol Chem. 2008. PMID: 18032380 Free PMC article.
References
-
- Haurand M, Ullrich V. J Biol Chem. 1985;260:15059–15067. - PubMed
-
- Ullrich V, Castle L, Weber P. Biochem Pharmacol. 1981;30:2033–2036. - PubMed
-
- Needleman P, Turk J, Jakschik BA, Morrison AR, Lefkowith JB. Annu Rev Biochem. 1986;55:69–102. - PubMed
-
- Hecker M, Ullrich V. J. Biol. Chem. 1989;264:141–150. - PubMed
-
- Hersleth HP, Ryde U, Rydberg P, Gorbitz CH, Andersson KK. J Inorg Biochem. 2006;100:460–476. - PubMed
Publication types
MeSH terms
Substances
Grants and funding
LinkOut - more resources
Full Text Sources
Molecular Biology Databases
Miscellaneous
