. 2007 Aug 15;365(1):144-56.
doi: 10.1016/j.virol.2007.02.035. Epub 2007 Apr 24.

TLR-4 and -6 agonists reverse apoptosis and promote maturation of simian virus 5-infected human dendritic cells through NFkB-dependent pathways

Affiliations

TLR-4 and -6 agonists reverse apoptosis and promote maturation of simian virus 5-infected human dendritic cells through NFkB-dependent pathways

Subhashini Arimilli et al. Virology. .

Abstract

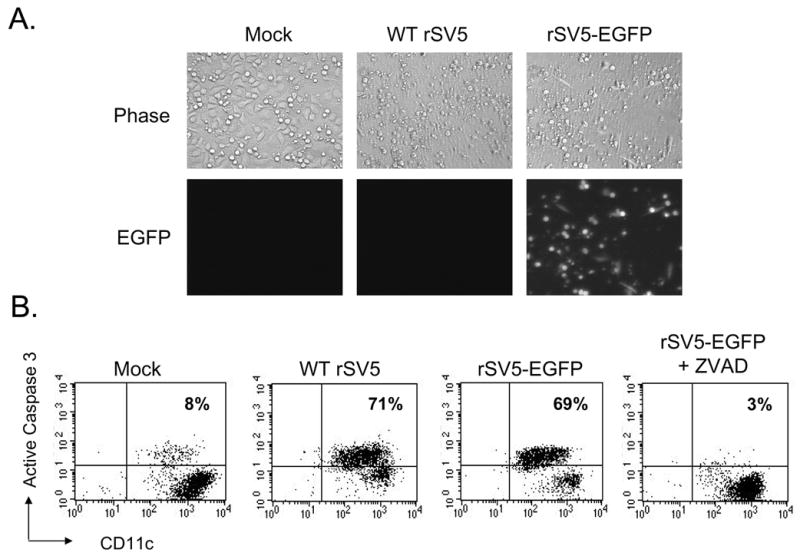
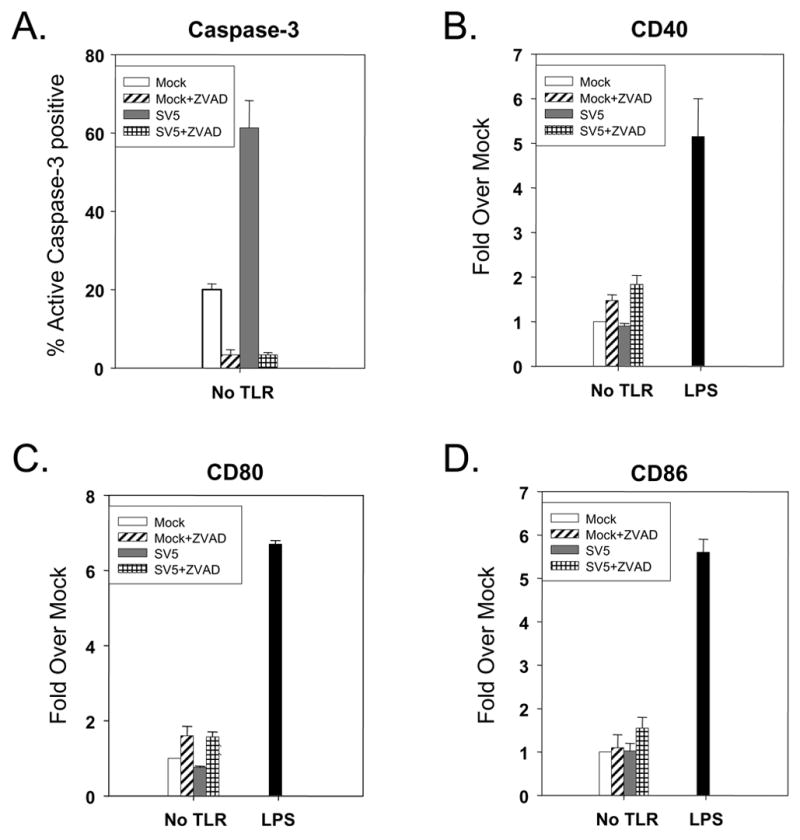
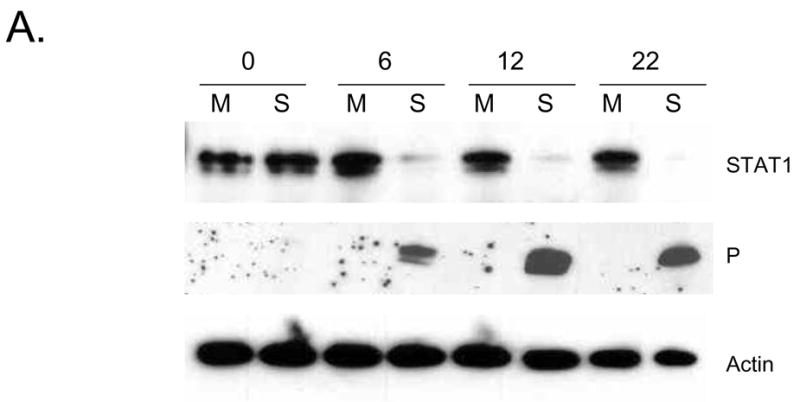
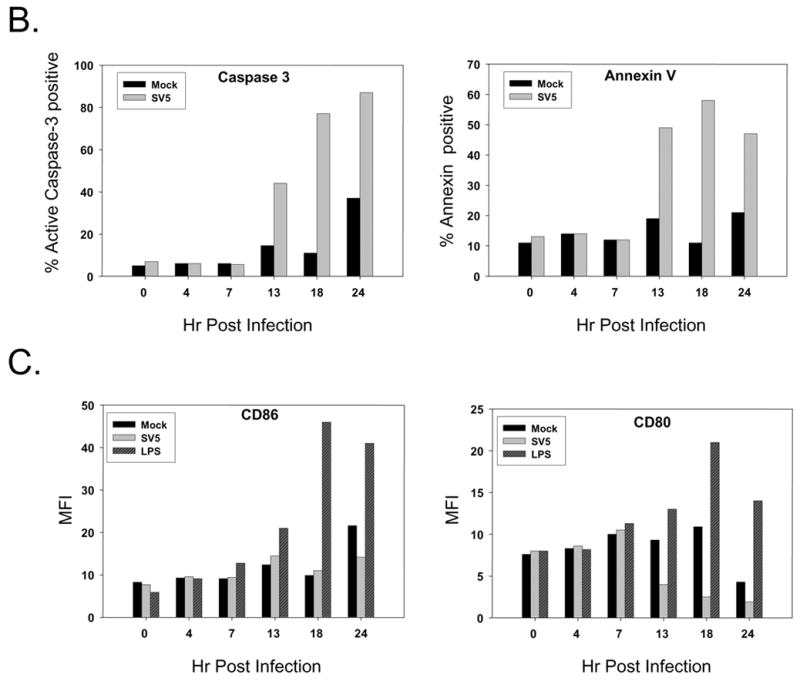
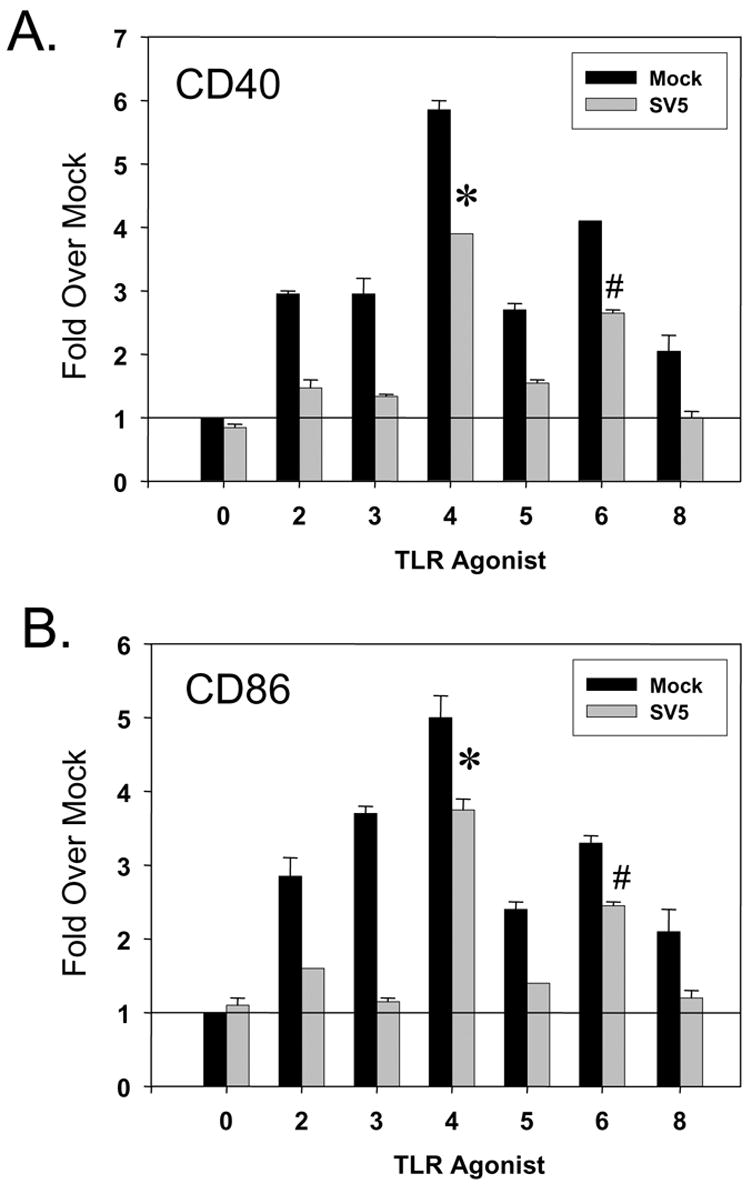
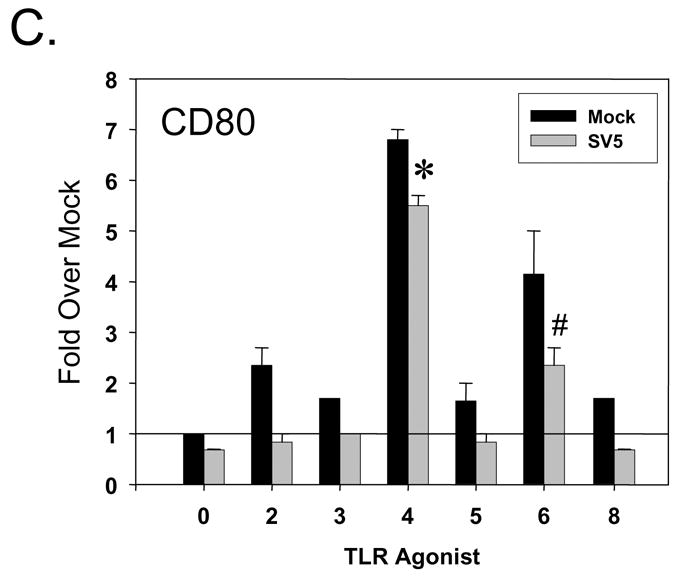
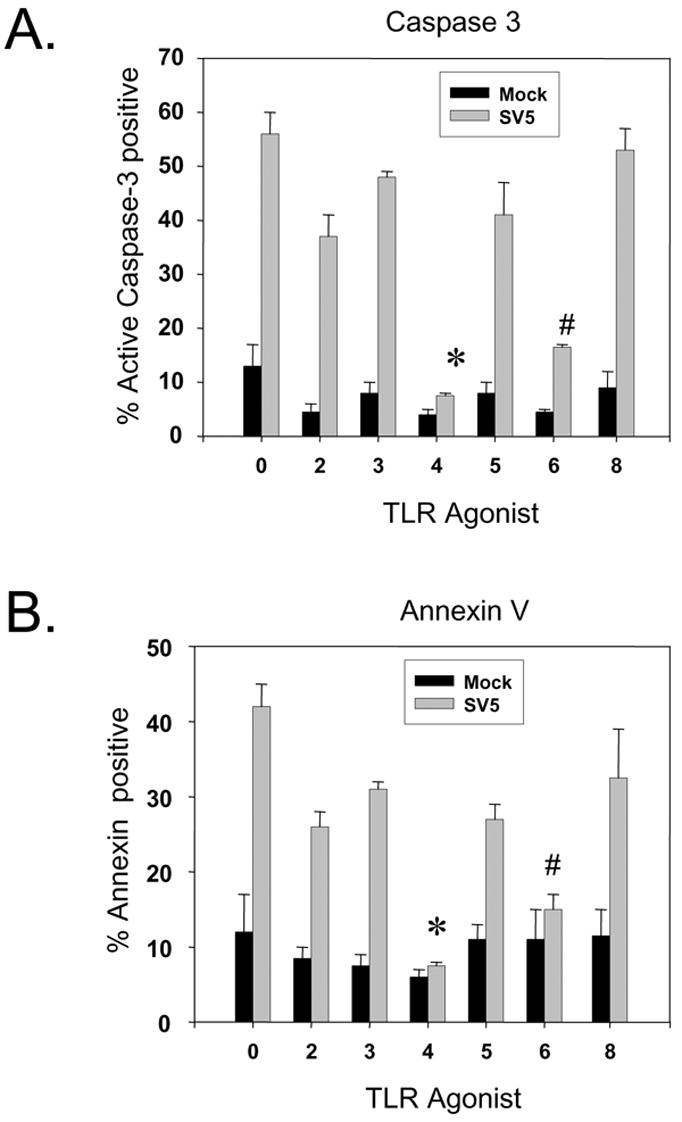
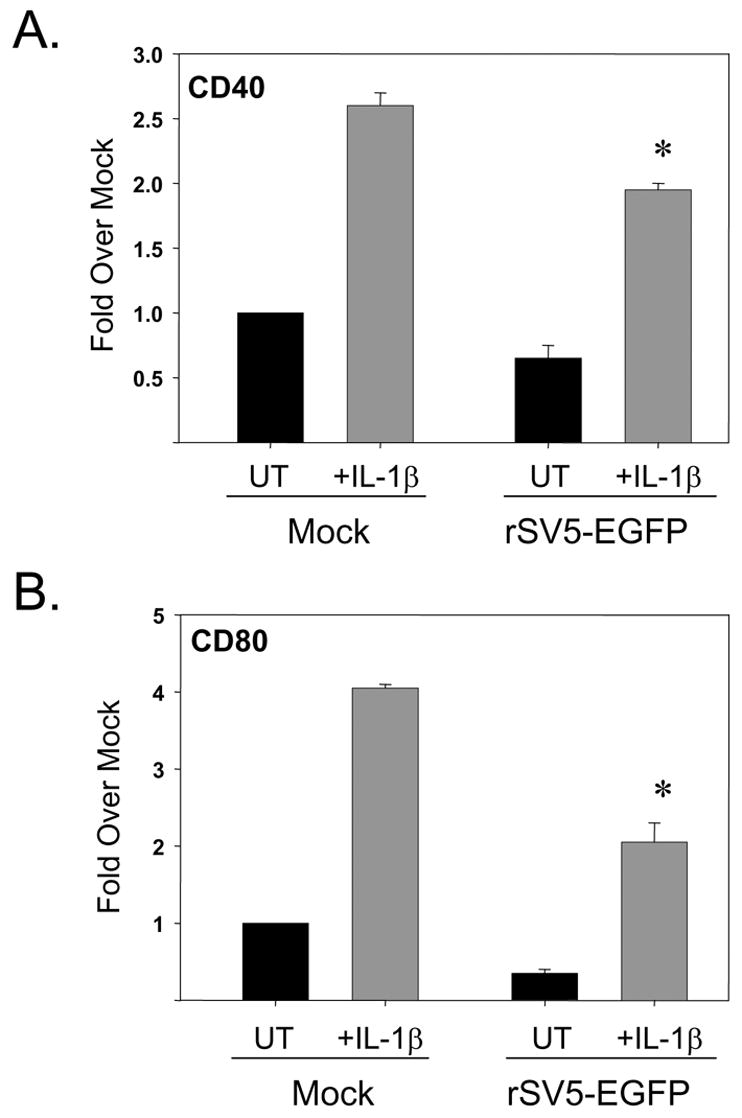
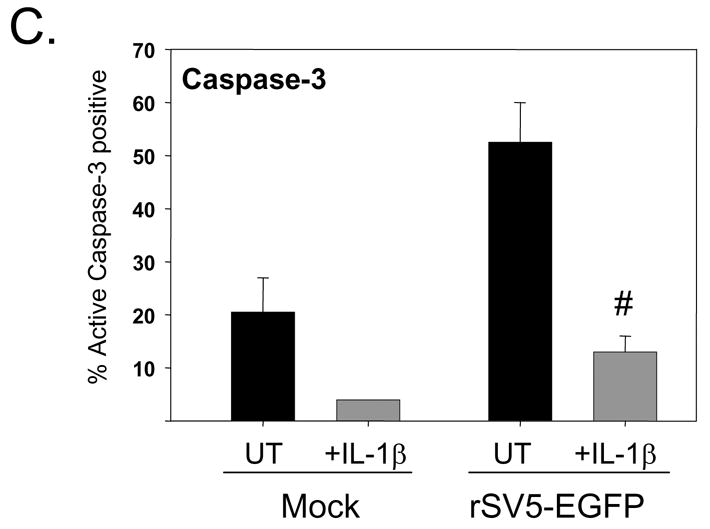
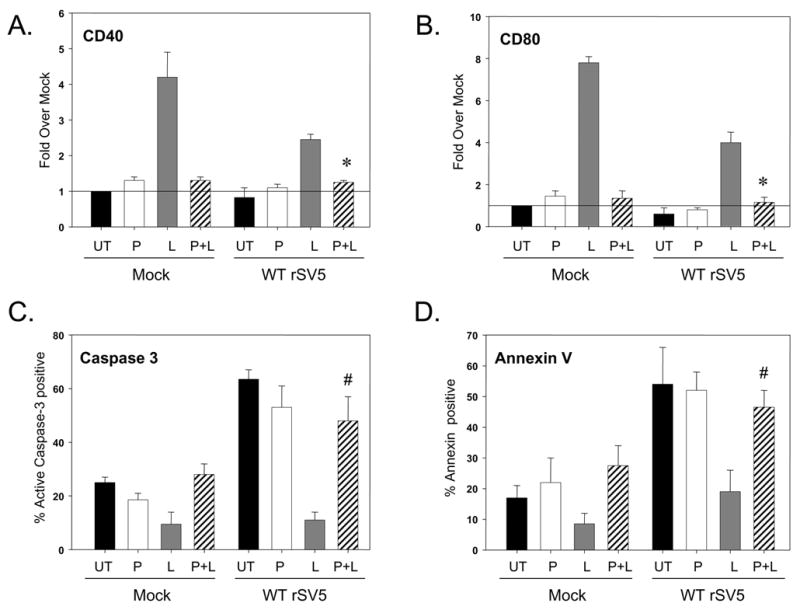
Infection of primary cultures of human immature monocyte-derived dendritic cells (moDC) with the paramyxovirus Simian Virus 5 (SV5) results in extensive cytopathic effect (CPE) and induction of apoptosis, but DC maturation pathways are not activated. In this study, we investigated the relationship between SV5-induced apoptosis and the lack of DC maturation. Reducing CPE and apoptosis in SV5-infected immature DC by the addition of a pancaspase inhibitor resulted in only low level expression of maturation markers CD40, CD80 and CD86, suggesting that SV5 infection either actively blocked maturation pathways or failed to provide sufficient signals to activate maturation. To distinguish between these hypotheses, SV5-infected immature DC were challenged with agonists that stimulate toll-like receptors (TLRs). Treatment with the TLR-4 agonist LPS or TLR-6 agonist FSL1 enhanced cell surface expression of CD40, CD80 and CD86 on SV5-infected cells to levels approaching that of mock-infected TLR-treated moDC, but treatment with agonists for TLR-2, -3, -5 or -8 had little effect. Addition of TLR-4 or -6 agonists to SV5-infected DC also dramatically reduced CPE and apoptosis, but the levels of viral protein and virus yield were not affected. Similarly, SV5-infected immature moDC were matured by treatment with IL-1beta, and these mature infected cells also showed reduced CPE and apoptosis. In the presence of NFkB inhibitors, TLR-4 and -6 agonists did not promote maturation or reduce apoptosis of SV5-infected DC, indicating that maturation and cell survival were both dependent on signaling through NFkB-dependent pathways. Our results suggest a model whereby SV5 replication induces apoptosis in immature DC but fails to provide strong maturation signals, while activation of NFkB-dependent pathways by exogenous ligands can lead to moDC maturation and override SV5-induced cell death.


Figures

Figure 1
Figure 1. WT SV5 and rSV5-EGFP are cytopathic in primary cultures of immature moDC
A) Immature moDC from a representative donor were mock infected or infected at an moi of 5 with WT rSV5 or rSV5-EGFP. Phase-contrast and EGFP expression were visualized at 22 h pi. B) Immature moDC infected with the indicated viruses were analyzed by flow cytometry at 22 h pi for intracellular levels of activated caspase-3 and cell surface CD11c. z-VAD-FMK was included in one culture of infected DC at 100 uM. Numbers in the upper quadrant indicate the percent of CD11c+ cells that stained positive for cleaved caspase-3. Representative of three experiments.
Figure 2
Figure 2. Pan-caspase inhibitor decreases apoptosis in SV5 infected immature moDC, but results in only low levels of cell surface maturation markers
Immature moDC were mock infected or infected at an moi of 5 with WT rSV5 and then treated with or without 100 uM z-VAD-FMK. Levels of intracellular cleaved caspase-3 (panel A) and the indicated cell surface maturation markers (panels B–D) were assayed by flow cytometry at 24 h pi. Cells treated with 200 ng/ml of LPS were used as a positive control. Results are the average of three experiments from three individual donors (with standard error bars). Results in panels B–D are expressed as a fold change relative to mock infected, mock treated sample set at 1.
Figure 3
Figure 3. Timecourse of STAT1 degradation, viral protein expression, apoptotic markers and maturation markers during SV5 infection of immature moDC
A) Immature moDC from a representative donor were mock infected (M lanes) or infected at an moi of 5 with WT rSV5 (S lanes). Cell lysates were prepared at the indicated times pi, and analyzed by western blotting for STAT1, P protein and actin. B and C) Timecourse of appearance of apoptotic markers and maturation markers. Immature DC from a representative donor were mock infected or infected at an moi of 5 with WT rSV5. At the indicated times pi, cells were analyzed by flow cytometry for intracellular levels of active caspase-3 and cell surface annexinV (panel B), or for cell surface CD86 and CD80 (panel C). In panel C, a sample of mock infected immature moDC were treated at time 0 with LPS to serve as a positive control for the timecourse of appearance of DC maturation markers.
Figure 4
Figure 4. TLR-4 and -6 agonists induced cell surface maturation markers on SV5-infected immature moDC
Immature moDC were mock infected or infected at an moi of 5 with WT rSV5. At 7 h pi, cells were mock treated or treated with the indicated TLR agonists as detailed in Materials and Methods. Levels of cell surface CD40 (panel A), CD86 (panel B) and CD80 (panel C) were determined by flow cytometry. Mean fluorescent intensities from three experiments using three individual donors (with standard error bars) are expressed as a fold change relative to mock infected, mock treated sample set at 1 (indicated by horizontal line). *, P values for CD40, CD86 and CD80 on TLR-4 agonist treated SV5 infected cells compared to untreated infected control cells were 0.0003, 0.002 and 0.005, respectively. #, P values for CD40, CD86 and CD80 on TLR-6 agonist treated infected cells compared to untreated SV5 infected control cells were 0.002, 0.04, and 0.007, respectively.
Figure 5
Figure 5. Apoptotic markers in SV5 infected immature moDC are reduced by treatment with TLR-4 and -6 agonists
Mock infected or WT rSV5 infected immature DC were treated at 7 h pi with the indicated TLR agonists as detailed in Materials and Methods. Cells were analyzed by flow cytometry at 22 h pi for levels of intracellular cleaved caspase-3 (panel A) or cell surface annexinV staining (panel B). Results are the mean values (with standard error bars) from three experiments with three individual donors. *, P values for percent active caspase-3 and annexin positive cells on TLR-4 agonist treated SV5 infected cells compared to untreated infected control cells were 0.007. #, P values for percent active caspase-3 and annexin positive cells on TLR-6 agonist treated infected cells compared to untreated infected control cells were 0.01 and 0.017, respectively.
Figure 6
Figure 6. TLR-4 and -6 agonist treatment of SV5 infected immature moDC does not reduce virus replication
A) Immature moDC from a representative donor were mock infected or infected with rSV5-EGFP at an moi of 5. At 6 h pi, samples were left untreated (UT) or treated with the TLR-4 agonist LPS (200 ng/ml) or TLR-6 agonist FSL1 (100 ng/ml). Phase contrast pictures and EGFP expression were assayed at 22 h pi. Representative of three experiments. B) Immature moDC were infected as described for panel A, except that cell lysates were prepared at 0 and 6 h pi. Parallel samples were then left untreated (U lanes) or treated with LPS (L lanes) or FSL1 (F lanes). Cell lysates were prepared at 12 and 22 h pi, and levels of SV5 P and V proteins or cellular actin were assayed by western blotting. Representative of two experiments. C) At 6 h pi, immature moDC infected with rSV5-EGFP were left untreated (UT) or treated with LPS or FSL1. Virus titers were determined at 22 h pi. Values are the average of three experiments using three donors with standard deviations indicated by bars.
Figure 7
Figure 7. Enhanced maturation and reduced CPE in SV5 infected moDC treated with the non-TLR agonist IL-1beta
Immature moDC were mock infected or infected at high moi with WT rSV5. At 6 h pi, cells were left untreated (UT samples) or treated with 10 ng/ml IL-1beta. Levels of cell surface CD40 (panel A), CD80 (panel B), and intracellular cleaved caspase-3 (panel C) were determined by flow cytometry. Results are the average of mean fluorescent intensities from three experiments using three individual donors (with standard error bars). CD40 and CD80 results are expressed as a fold change relative to mock infected, mock treated sample set at 1. *, P values for CD40 and CD80 on IL-1beta treated infected cells compared to untreated infected control cells were 0.007 and 0.02, respectively. #, P values for percent active caspase-3 on IL-1beta treated infected cells compared to untreated infected control cells was 0.05.
Figure 8
Figure 8. TLR-4 mediated maturation and reduced apoptosis of SV5 infected immature moDC is blocked by NFkB inhibitors
Immature moDC were mock infected or infected at high moi with WT rSV5 and left untreated (UT; black bars) or cultured in the presence of 10 uM PDTC (P, white bars). At 6 h pi, 200 ng/ml LPS was added to samples lacking PDTC (L, gray bars) or samples treated with PDTC (P + L, striped bars). At 22 h pi, samples were analyzed as detailed in the legend to Fig. 7. *, P values for CD40 and CD80 on P + L treated infected cells compared to L treated infected control cells were 0.006 and 0.018, respectively. #, P values for percent active caspase-3 and annexin positive cells on P + L treated infected cells compared to L treated infected control cells were 0.1 and 0.034, respectively.

References

    1. Alexopoulou LA, Holt C, Medzhitov R, Flavell Ra. Recognition of double-stranded RNA and activation of NF-kB by toll-like receptor 3. Nature. 2001;413:732–738. - PubMed
    1. Ardeshna KM, Pizzey AR, Devereux S, Khwaja A. The PI3 kinase, p38 SAP kinase, and NF-kB signal transduction pathways are involved in the survival and maturation of lipopolysaccharide-stimulated human monocyte-derived dendritic cells. Blood. 2000;96:1039–1046. - PubMed
    1. Arimilli S, Alexander-Miller MA, Parks GD. A simian virus 5 (SV5) P/V mutant is less cytopathic than wild-type SV5 in human dedritic and is a more effective activator of dendritic cell maturation and function. J Virol. 2006;80:3416–3427. - PMC - PubMed
    1. Baize S, Kaplon J, Faure C, Pannetier D, Georges-Courbot MC, Deubel V. Lassa virus infection of human dendritic cells and macrophages is productive but fails to activate cells. J Immunol. 2004;172:2861–2869. - PubMed
    1. Baize S, Pannetier D, Faure C, Marianneau P, Marendat L, Georges-Courbot MC, Deubel V. Role of interferons in the control of Lassa virus replication in human dendritic cells and macrophages. Microbes and Infection. 2006;8:1194–1202. - PubMed

Publication types

MeSH terms