. 2007 Apr 25;27(17):4530-40.
doi: 10.1523/JNEUROSCI.0772-07.2007.

Transient synaptic silencing of developing striate cortex has persistent effects on visual function and plasticity

Affiliations

Transient synaptic silencing of developing striate cortex has persistent effects on visual function and plasticity

Matteo Caleo et al. J Neurosci. .

Abstract

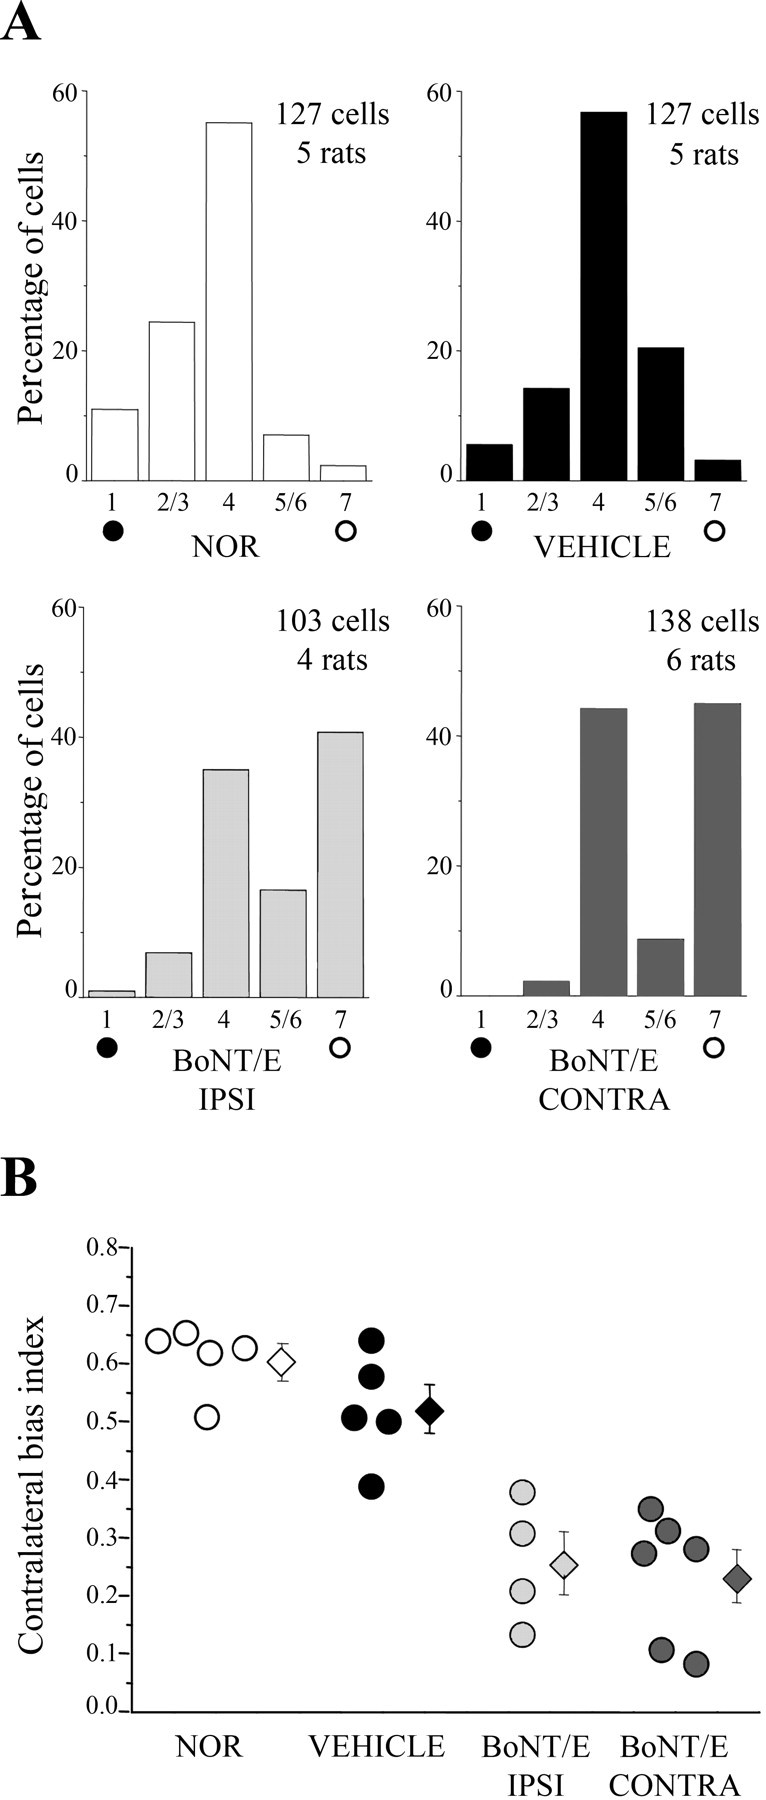
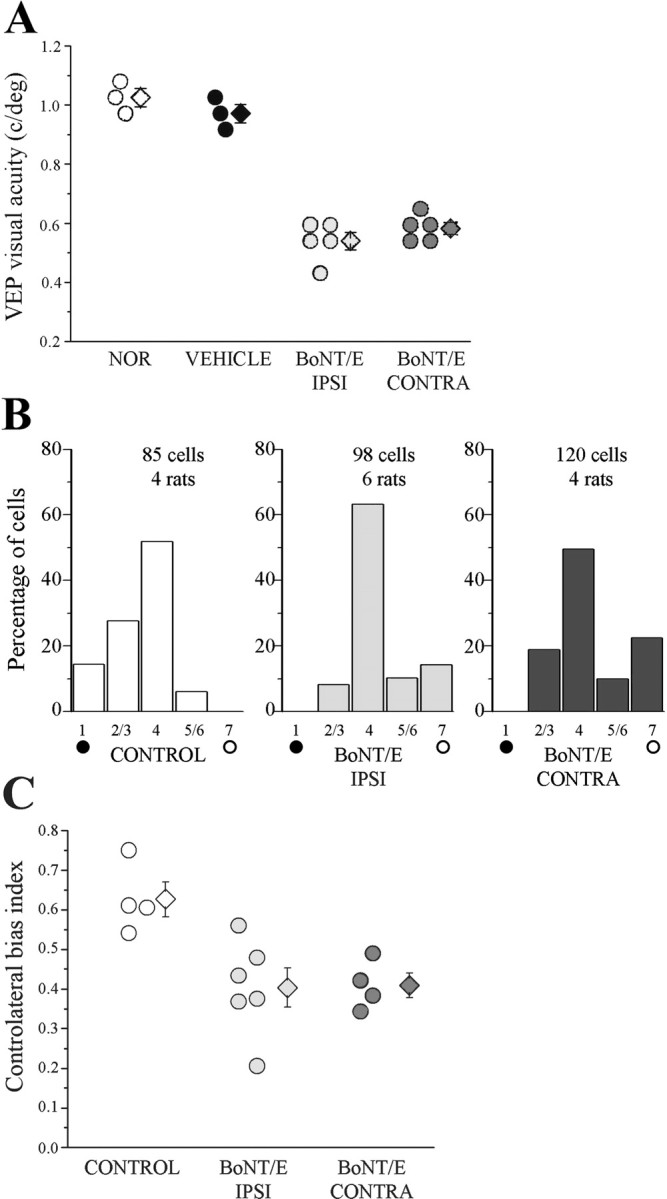
Neural circuits in the cerebral cortex are shaped by experience during "critical periods" early in life. For example, visual cortex is immature at the time of eye opening and gradually develops its functional properties during a sensitive period. Very few reports have addressed the role of intrinsic neural activity in cortical maturation. Here we have exploited the bacterial enzyme botulinum neurotoxin E (BoNT/E) to produce a unilateral, reversible blockade of neural activity in rat visual cortex during the sensitive period. BoNT/E is a highly selective protease that interferes with transmitter release via cleavage of the synaptic protein SNAP-25 (synaptosomal-associated protein of 25 kDa). Unilateral, intracortical injections of BoNT/E were made at the time of eye opening and resulted in the silencing of the treated, but not contralateral, hemisphere for a period of 2 weeks. We found that visual acuity was permanently reduced in the blocked hemisphere, and the critical period for ocular dominance plasticity persisted into adulthood. Unexpectedly, these effects extended equally to the contralateral, uninjected side, demonstrating a fundamental role for interhemispheric connections in cortical maturation.


Figures

Figure 1.
Figure 1.
Characterization of BoNT/E effects in the visual cortex. A, Immunostaining for cleaved SNAP-25 (dark labeling) in a coronal section through the occipital cortex and midbrain of a P16 rat, 2 d after unilateral BoNT/E injection. Cleaved SNAP-25 is evident in the binocular visual cortex (delimited by arrows) of the infused side (right), whereas no signal is detectable in the contralateral hemisphere (left). The superior colliculus is also devoid of staining. Scale bar, 1 mm. B, Confocal images of immunostaining for intact SNAP-25 in the cortex of a P16 rat that received a unilateral BoNT/E infusion 2 d earlier. Although the uninjected hemisphere (left) displays the normal punctate staining characteristic of SNAP-25, immunoreactivity is virtually completely abolished on the treated side (right). Scale bar, 100 μm. C, Representative immunoblotting for intact (S-25) and cleaved (cl. S-25) SNAP-25 on cortical protein extracts from P15 rats. Tissues were harvested from normal animals (NOR) and from the side contralateral (CONTRA) and ipsilateral (IPSI) to BoNT/E, 1 d after infusion. Each lane represents one animal. β-tub, β-Tubulin (internal standard).
Figure 2.
Figure 2.
Functional consequences of BoNT/E infusion. A, Top, Representative extracellular recordings of spiking activity from the binocular cortex ipsilateral (right) and contralateral (left) to BoNT/E infusion, 2 d after toxin injection. Passage of a light-bar stimulus across the visual field is indicated by the horizontal bars under the trace (each horizontal bar, 1.90 s). Bottom, Examples of peristimulus time histograms recorded in the infused (right) and contralateral (left) cortex. Visual response is abolished in the BoNT/E-treated hemisphere. B, Representative physiological mapping of the effects of BoNT/E in a P17 rat (i.e., 3 d after injection). The BoNT/E injection sites (asterisks) and the location of six microelectrode penetrations are shown on a dorsal view of the rat brain. Five penetrations (numbered 1–5) were made in the binocular visual cortex (Oc1B) of the infused hemisphere and showed no VEP response (see traces in the box). A robust field potential response (track number six) could be evoked from the uninjected side. λ, Lambda suture.
Figure 3.
Figure 3.
Reversibility of BoNT/E effects. A, Representative VEP responses from both hemispheres of animals injected with BoNT/E at P14. Age of recording is indicated on the left. Note reduced VEP amplitude and increased latency in the treated side at P28. Responses in the injected side are completely recovered by P35. CONTRA, Contralateral; IPSI, ipsilateral. B, Immunoblotting for cleaved SNAP-25 on protein extracts from the visual cortex at different times after BoNT/E injection. Cleaved SNAP-25 is no longer detectable 21 d after BoNT/E. cl. S-25, Cleaved SNAP-25; β-tub, β-tubulin (internal standard). C, Intact and BoNT/E-truncated SNAP-25 at different times after one single injection of BoNT/E at P14. Cortical protein extracts were separated and blotted, and filters were probed with an antibody raised against the N-terminal domain of SNAP-25 that allows simultaneous visualization of intact (S-25) and BoNT/E-cleaved SNAP-25 (cl. S-25). β-tub, β-Tubulin (internal standard). D, Densitometric analysis of intact (black circles) and BoNT/E-cleaved (gray circles) SNAP-25. BoNT/E effects are stable for ∼1 week and decline thereafter, being completely off by P35. Error bars indicate SE and, when not seen, are within the symbol.
Figure 4.
Figure 4.
BoNT/E has no adverse effects on neuronal survival in the visual cortex. A, Mean ± SE cortical thickness in the various experimental groups. NOR, Cortex of normal animals; VEHICLE, cortex injected with vehicle solution; BoNT/E IPSI and CONTRA, hemisphere ipsilateral and contralateral to BoNT/E infusion. B, C, Mean ± SE neuronal density in layers II–III (B) and layers V–VI (C) of primary visual cortex in the various groups.
Figure 5.
Figure 5.
Bilateral impairments in spatial resolution in P35 BoNT/E rats. Summary of visual acuities in all animal groups. Each circle represents one animal. Mean visual acuity (diamonds) is significantly reduced in both hemispheres of BoNT/E rats compared with that in normal or vehicle-injected animals. Error bars indicate SE. Abbreviations as in Figure 3.
Figure 6.
Figure 6.
Activity blockade has no effects on cortical binocularity. A, OD distributions of control and BoNT/E rats at P35. Control rats were either naive (NOR) or injected with vehicle at P14 (VEHICLE). BoNT/E rats were injected at P14 and recorded both ipsilateral and contralateral to the infusion side (BoNT/E IPSI and BoNT/E CONTRA). Number of animals and cells as indicated. B, CBI of control and BoNT/E-treated rats at P35. Circles, Values of individual animals; diamonds, mean of the group. Error bars indicate SE and, when not seen, are within the symbol. No differences in OD can be detected among the groups (one-way ANOVA, p > 0.3).
Figure 7.
Figure 7.
Bilateral prolongation of the critical period in P35 BoNT/E rats. A, OD distributions in normal and vehicle- and BoNT/E-injected rats subjected to MD at P35. OD was assessed after 4–5 d of monocular occlusion. The deprived eye was always the eye contralateral to the cortical hemisphere being examined. Both hemispheres of BoNT/E rats display a significant shift toward the nondeprived eye (open circles). Number of animals and cells as indicated. Note that OD histograms for BoNT/E animals look bimodal, suggesting that two subsets of cortical cells are differentially sensitive to the activity blockade. B, CBI for all animals recorded in each experimental group (circles, values of single animals; diamonds, mean ± SE). MD effects are consistently detectable in both hemispheres of BoNT/E-injected rats. Abbreviations as in Figure 6.
Figure 8.
Figure 8.
Bilateral reductions in markers of intracortical inhibition in P35 BoNT/E rats. A, Mean density of GAD65-positive pixels in the neuropil (layers II–III) is significantly reduced in the cortex ipsilateral and contralateral to BoNT/E infusion with respect to both naive and vehicle-injected cortex. Error bars indicate SE. B, Quantification of GAD65 immunofluorescence in GABAergic terminals around the soma of target neurons. The box chart summarizes the distribution of the GAD65 signal-to-background ratio (intensity of GAD65 label in puncta rings divided by the background staining in the soma) for the cells in each experimental group. The horizontal lines in the box denote the 25th, 50th, and 75th percentile values. The error bars denote the 5th and 95th percentile values. The square symbol in the box denotes the mean of the column of data. GAD65 staining is less intense in both hemispheres of BoNT/E-injected rats compared with normal and vehicle-injected cortex (one-way ANOVA followed by Dunn's test, p < 0.05). C, Mean ± SE density of perineuronal nets surrounded neurons in layer II/III. Density of WFA-positive cells is reduced ipsilateral and contralateral to BoNT/E infusion. Abbreviations as in Figure 6.
Figure 9.
Figure 9.
Deficits in behavioral acuity in adult BoNT/E rats. A, Representative frequency-of-seeing curves for a normal rat (white symbols) and a BoNT/E rat (gray symbols). Each point is the average performance at a spatial frequency. A sigmoid curve is fit to the data, and the point at which the curve intersects 70% accuracy is taken as the grating threshold. B, Summary of data on behavioral visual acuity. Each circle represents one animal. Mean ± SE visual acuity (diamonds) is significantly reduced in BoNT/E animals with respect to normal or vehicle-injected rats (ANOVA; post hoc Holm–Sidak test, p < 0.01).
Figure 10.
Figure 10.
Persistent bilateral impairments in visual acuity and enduring plasticity in adult BoNT/E rats. A, VEP visual acuity of P60–P100 animals. Acuity is poor in both hemispheres of BoNT/E-treated rats (circles, single animal values; diamonds, mean). Error bars indicate SE and, when not seen, are within the symbol. B, OD distributions in animal older than P60 subjected to MD. The control group includes one vehicle-injected rat and three normal animals. In each hemisphere, OD was assessed after 4–5 d of occlusion of the contralateral eye. An OD shift in favor of the open eye (open circles) is observed in both hemispheres of BoNT/E-treated rats but not in the control group. Number of animals and cells as indicated. C, CBI for all animals recorded in each experimental group (circles, values of single animals; diamonds, mean ± SE). CBI values are lower than normal in both hemispheres of BoNT/E-injected rats (post ANOVA Holm–Sidak test, p < 0.05). Abbreviations as in Figure 6.
Figure 11.
Figure 11.
Persistent bilateral downregulation of inhibition in adult BoNT/E rats. Mean density of GAD65-positive pixels in the neuropil (layers II–III) of rats older than P100. The density of presynaptic inhibitory terminals is significantly reduced in the cortex ipsilateral (IPSI) and contralateral (CONTRA) to BoNT/E infusion with respect to the vehicle-injected cortex. Error bars indicate SE.
Figure 12.
Figure 12.
Reduced neuronal firing after blockade of the opposite hemisphere. A, Representative recordings of spontaneous spiking activity from visual cortical neurons, before and after muscimol (or saline) injection into the contralateral hemisphere. B, Quantification of spontaneous firing rates before and after muscimol (or saline) infusion into the contralateral hemisphere. The box chart summarizes the distribution of spontaneous activity for the cells in each experimental group (saline, n = 51 cells; muscimol, n = 61 cells). The horizontal lines in the box denote the 25th, 50th, and 75th percentile values. The error bars denote the 5th and 95th percentile values. The square symbol in the box denotes the mean of the column of data. Spontaneous discharge is significantly reduced after muscimol delivery to the opposite side (one-way ANOVA, p < 0.001, followed by Dunn's test, p < 0.05).

References

    1. Benevento LA, Bakkum BW, Port JD, Cohen RS. The effects of dark-rearing on the electrophysiology of the rat visual corte. Brain Re. 1992;572:198–207. - PubMed
    1. Berardi N, Pizzorusso T, Maffei L. Critical periods during sensory development. Curr Opin Neurobiol. 2000;10:138–145. - PubMed
    1. Berardi N, Pizzorusso T, Ratto GM, Maffei L. Molecular basis of plasticity in the visual cortex. Trends Neurosci. 2003;26:369–378. - PubMed
    1. Berlucchi G, Rizzolatti G. Binocularly driven neurons in visual cortex of split-chiasm cats. Science. 1968;159:308–310. - PubMed
    1. Blakemore C, Diao YC, Pu ML, Wang YK, Xiao YM. Possible functions of the interhemispheric connexions between visual cortical areas in the cat. J Physiol (Lond) 1983;337:331–349. - PMC - PubMed

Publication types

MeSH terms

LinkOut - more resources