. 2007 Apr 25;27(17):4572-86.
doi: 10.1523/JNEUROSCI.0326-07.2007.

The triphasic intrinsic signal: implications for functional imaging

Affiliations

The triphasic intrinsic signal: implications for functional imaging

Cynthia H Chen-Bee et al. J Neurosci. .

Abstract

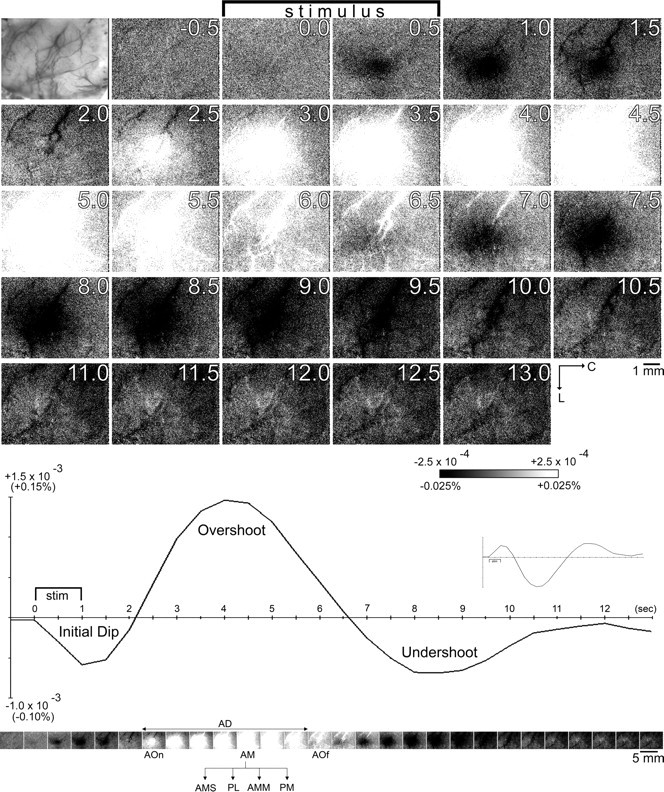
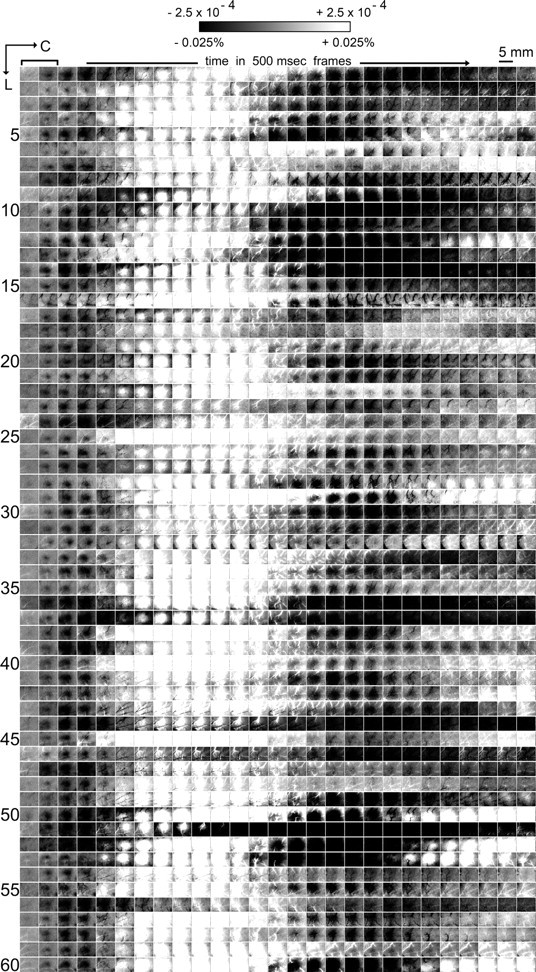
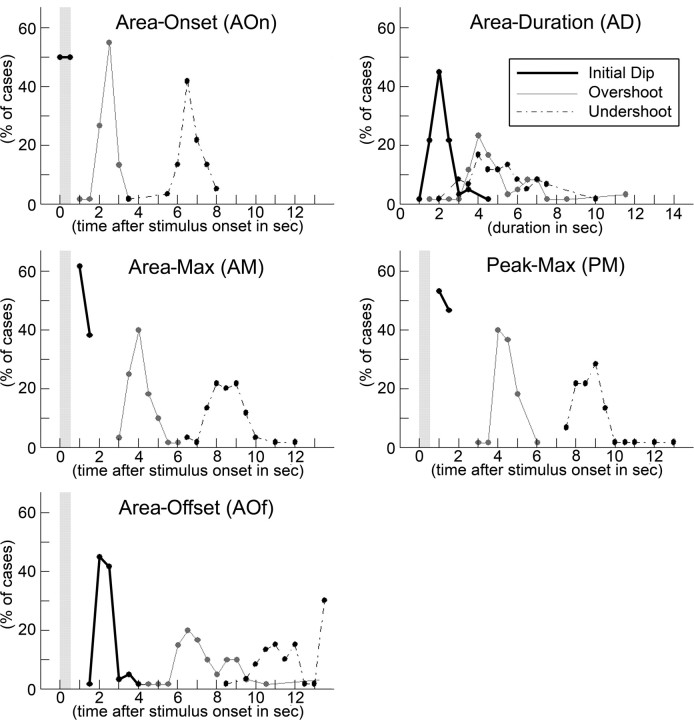
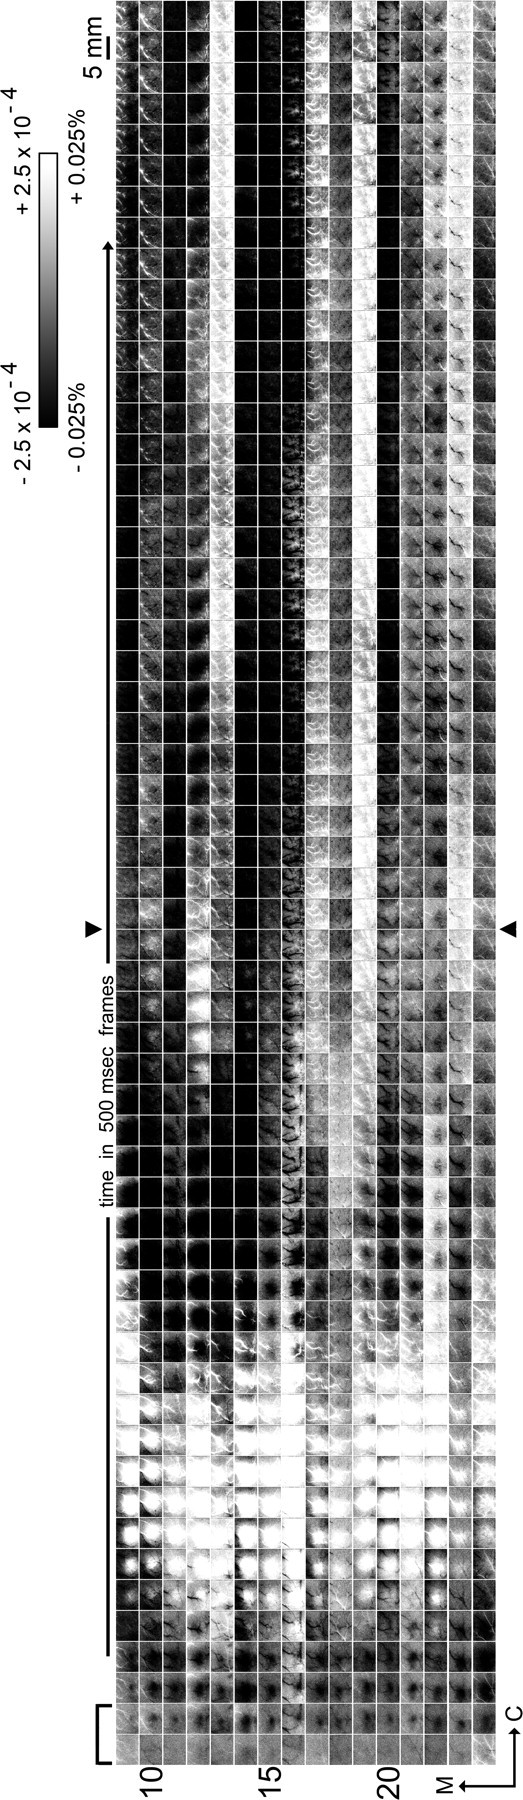
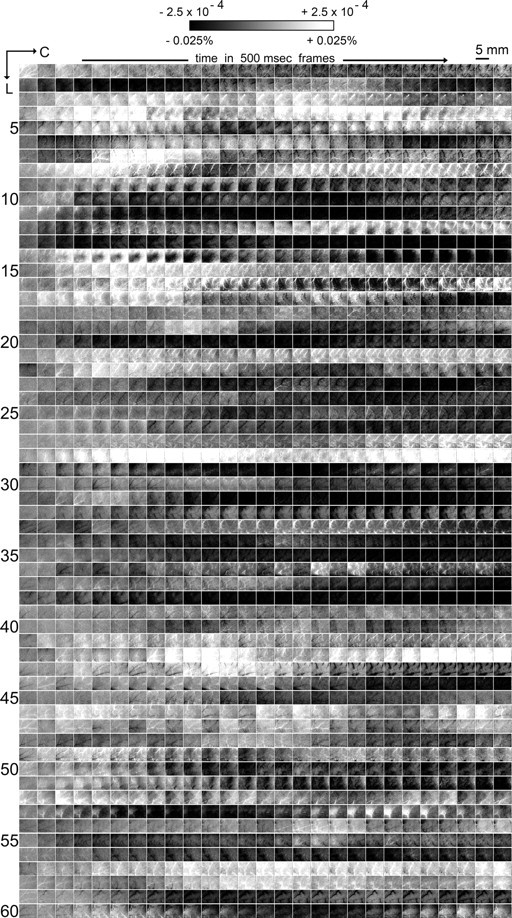
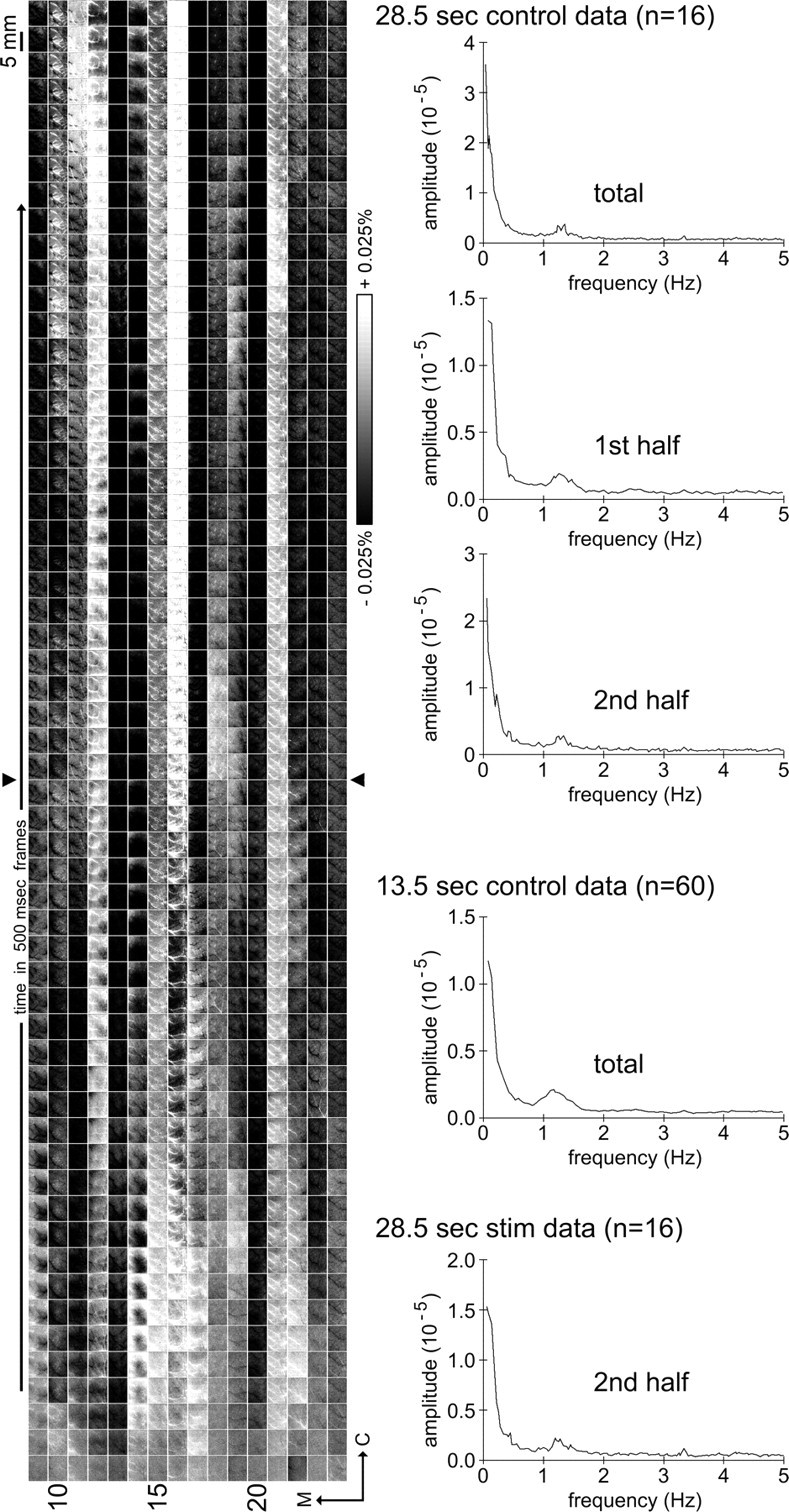
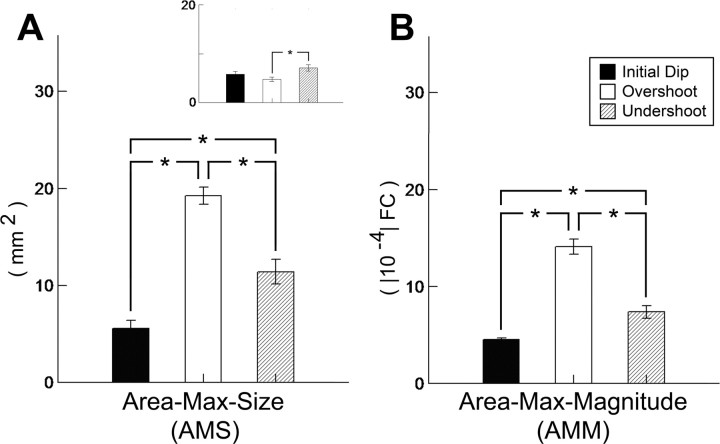
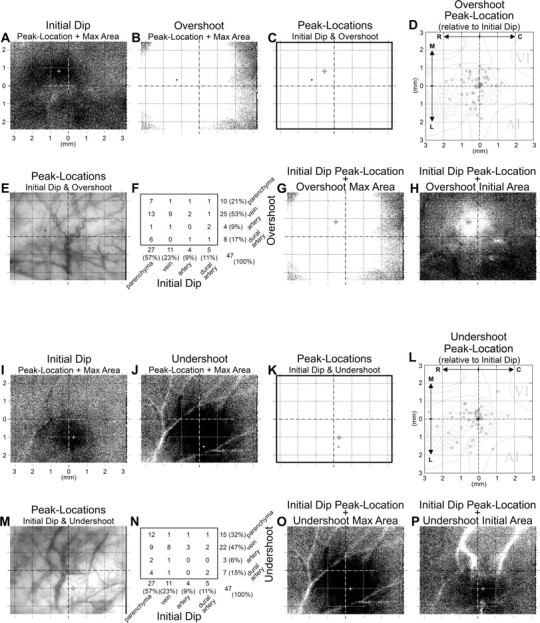
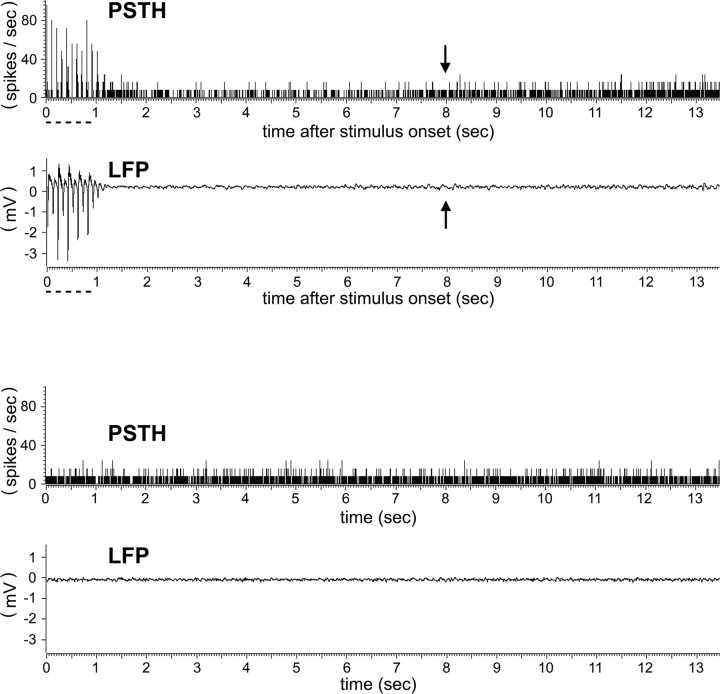
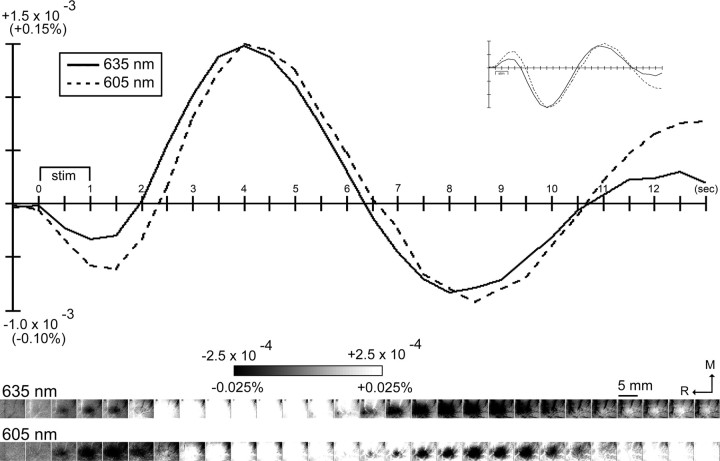
Intrinsic signal optical imaging with red illumination (ISOI) is used extensively to provide high spatial resolution maps of stimulus-evoked hemodynamic-related signals as an indirect means to map evoked neuronal activity. This evoked signal is generally described as beginning with an undershoot or "dip" in signal that is faster, more transient, and weaker compared with the subsequent signal overshoot. In contrast, the evoked signal detected with blood oxygen level-dependent (BOLD) functional magnetic resonance imaging (fMRI) is generally described as containing an undershoot after the initial dip and overshoot, even though it, too, detects hemodynamic-related signals and its first two phases appear complementary to those of ISOI. Here, we used ISOI with 635 nm illumination to image over 13.5 s after a 1 s stimulus delivery to detect and successfully use the ISOI undershoot phase for functional mapping. Eight spatiotemporal attributes were assessed per signal phase including maximum areal extent and peak magnitude, both of which were largest for the ISOI overshoot, followed by the undershoot and then the initial dip. Peak activity location did not colocalize well between the three phases; furthermore, we found mostly modest correlations between attributes within each phase and sparse correlations between phases. Extended (13.5 s) electrophysiology recordings did not exhibit a reoccurrence of evoked suprathreshold or subthreshold neuronal responses that could be associated with the undershoot. Beyond the undershoot, additional overshoot/undershoot fluctuations were also mapped, but were typically less spatiotemporally specific to stimulus delivery. Implications for ISOI and BOLD fMRI are discussed.


Figures

Figure 1.
Figure 1.
Visualization of evoked intrinsic signal and the eight spatiotemporal parameters assessed for signal phase characterization. Data from a representative rat is provided to illustrate that high-spatial resolution images of intrinsic signal activity was obtained in 500 ms frames for an extended time epoch after stimulus onset (up to 13.5 s). Top, A photograph is provided of the vasculature present on the surface of the imaged cortical region. Images of poststimulus data were created by first converting data into fractional change values relative to the 500 ms frame collected immediately before stimulus onset on a pixel-by-pixel basis before applying an eight-bit linear grayscale to the processed data such that middle gray equals no change relative to prestimulus data, darker gray values equal larger undershoots, lighter gray values equal larger overshoots, and darkest (black) and lightest (white) values were thresholded at ±2.5 × 10⁻⁴ or ±0.025% (for details, see Materials and Methods). Prestimulus data can be visualized by creating an image in a similar manner, where the 500 ms frame immediately preceding stimulus onset (−0.5 s time point) is converted relative to the −1.0 s time point. The stimulus bar indicates when the 1 s stimulus delivery occurred. The 1 mm scale bar and neuroaxis apply to all images. Bottom, Line plot of the fractional change values was obtained from a single binned pixel located centrally within the imaged cortex, with the inset containing the same data points plotted upside down as is traditionally done in ISOI studies. The same images seen above were reduced in size and redisplayed below the line plot for easier comparison along the temporal domain. The five millimeter scale bar applies to all images; the neuroaxis remains the same. The same processing of data and application of the grayscale to the processed data are applicable to all subsequent figures containing high-spatial visualization of intrinsic signals. Note that after stimulating a single whisker for 1 s, a triphasic intrinsic signal was evoked starting with an initial dip followed by an overshoot and then an undershoot. For a comprehensive characterization of the intrinsic signal, eight spatiotemporal parameters were assessed for each signal phase: area-onset time (AOn), area-max time (AM), area-offset time (AOf), area duration (AD), area-max size (AMS), peak location (PL), area-max magnitude (AMM), and peak-max time (PM). For details, see Materials and Methods.
Figure 2.
Figure 2.
Visualization of the evoked intrinsic signal across 60 rats. Images of evoked intrinsic signal in 500 ms frames are provided through 13.5 s after the onset of a 1 s stimulus delivery to a single whisker (one row per rat). A total of 64 stimulation trials were collected per rat for the first 24 rats, whereas 128 trials were collected for the remaining 36 rats. Stimulus bar in the top left corner indicates that the 1 s stimulus delivery occurs during the first two frames and applies to all rows. Grayscale, 5 mm scale bar, and neuroaxis apply to all images. Across all rats, the evoked intrinsic signal is reliably triphasic, consisting of an initial dip (first prolonged presence of a black activity area) followed by an overshoot (first prolonged white activity area) and then an undershoot (second prolonged black activity area). Although some variability existed across rats, consistent differences between the three signal phases were apparent including time after stimulus onset when an activity area first appeared (area-onset time), total duration of activity area presence (area duration), and spatial extent size of the maximum activity area (area-max size). Note that by the end of the 13.5 s poststimulus time epoch, an additional overshoot and/or undershoot was observed in the majority of rats.
Figure 3.
Figure 3.
Temporal profile of the evoked activity area per signal phase. Regarding the entire period that an evoked activity area is present, the following temporal characteristics were assessed per signal phase: area-onset time (AOn), area-max time (AM), area-offset time (AOf), area duration (AD), and peak-max time (PM). For details, see Materials and Methods. Occurrence of the 1 s stimulus delivery to a single whisker is indicated in all but the fourth panel with a vertical gray bar. Although some variability existed across rats, note that the initial dip, overshoot, and undershoot phases of the evoked intrinsic signal exhibited stereotypical time points with respect to when the area onset, area max, and area offset occurred, as well as when peak max occurred. Also, the total duration that the evoked activity area was present (area duration) was about twice as long for the overshoot and undershoot compared with the initial dip, and that area max and peak max occurred at similar time points.
Figure 4.
Figure 4.
Visualization of the evoked intrinsic signal extended through 28.5 s after stimulus onset. In a subset of cases (16 rats; first 13.5 s of poststimulus data are also presented in Fig. 2, rows 9 through 24), evoked intrinsic signal was followed in 500 ms frames up to 13.5 s after the 1 s stimulus delivery, plus an additional 15 s for a total of up to 28.5 s after stimulus onset. Trial duration was extended farther to determine whether other reliable signal phases exist beyond the undershoot of the triphasic signal (second prolonged presence of a black activity area). Images are rotated 90° counterclockwise such that medial is toward the left of the panel and rostral is toward the bottom, time after stimulus onset increases from bottom to top, and one column summarizes data from one rat. The stimulus bar in the bottom left corner indicates that the 1 s stimulus delivery occurs during the first two frames and applies to all columns. Grayscale, 5 mm scale bar, and neuroaxis apply to all images; arrowheads separate the first 13.5 s of poststimulus data from the subsequent additional 15 s of data. As illustrated previously in Figure 2, the evoked intrinsic signal is triphasic within 13.5 s after stimulus onset. Note that beyond the undershoot (second prolonged presence of a dark activity area), additional undershoots and/or overshoots can occur up to 28.5 s after stimulus onset. However, these additional undershoots/overshoots did not exhibit stereotypical characteristics such as time of area onset, area max, or area offset, and will be referred to hereafter as fluctuations.
Figure 5.
Figure 5.
Visualizing 13.5 s of control data across 60 rats. Images of intrinsic signal in 500 ms frames are provided for control trials (one row per rat) that were randomly interlaced with stimulation trials. A total of 64 control trials were collected per rat for the first 24 rats, whereas 128 trials were collected for the remaining 36 rats. Grayscale, 5 mm scale bar, and neuroaxis apply to all images. Similarly to the latter half of the 30 s stimulation trials presented in Figure 4, overshoot and/or undershoot fluctuations in intrinsic signal area were observed in control trials that were collected randomly with stimulation trials, although again these fluctuations did not exhibit stereotypical characteristics such as time of area onset, area max, or area offset.
Figure 6.
Figure 6.
Visualizing 28.5 s of control data across 16 rats and power spectral analysis of control data. Left, Images of intrinsic signal in 500 ms frames are provided for 30 s control trials randomly collected with 30 s stimulation trials (one row per rat; same subset of rats whose 30 s stimulation trials were presented in Fig. 4). Images are rotated 90° counterclockwise such that medial is toward the left of the panel, rostral is toward the bottom, time increases from bottom to top, and one column summarizes data from one rat. Grayscale, 5 mm scale bar, and neuroaxis apply to all images; arrowheads separate the first 13.5 s of data collection from the additional 15 s of data. Note that overshoot and/or undershoot fluctuations in intrinsic signal area were observed, but, as with the latter half of the 30 s stimulation trials in Figure 4, these overshoot/undershoot fluctuations did not exhibit stereotypical characteristics. Also note that these nonspecific overshoot/undershoot fluctuations occurred similarly between the first half versus the latter half of the 30 s control trials. Right, To characterize the oscillation frequencies of these nonspecific fluctuations, power spectral analysis was performed and the average spectrum density plots were generated for the 28.5 s control data (entire 28.5 s, first half, or second half; n = 16), the entire duration of the 13.5 s control data (n = 60), and the second half of the 28.5 s stimulation data (n = 16). Note that a strong primary peak in the ∼0.1 Hz range and a weak secondary peak in the ∼1–1.5 Hz range are observed in all spectrum density plots.
Figure 7.
Figure 7.
A, B, Interphase comparison of area-max size (AMS) and area-max magnitude (AMM). The spatial extent size of the maximum activity area (AMS) and the magnitude of peak activity within the quantified area (AMM) were assessed for all three signal phases. Means and SEs of the quantified data are provided for 60 rats. One-way repeated-measures ANOVAs followed by specific contrasts were performed on the transformed AMS and AMM data. Statistically significant differences between all possible pairs of signal phases were found for both AMS and AMM (indicated by asterisks). For details, see Results. A, Inset, The maximum activity area was also quantified using a normalized threshold of 50% AMM. In striking contrast to all other data of the present study, note that the smallest maximum activity area is actually observed for the overshoot signal phase and, thus, the 50% AMM threshold was not used any further.
Figure 8.
Figure 8.
Interphase comparison of peak activity location. Interphase comparison of peak location is meaningful, especially relative to the initial dip given that the initial dip peak response to stimulation used in the present study (single whisker C2 stimulation) has been shown previously to localize above the appropriate anatomical location (whisker C2 anatomical representation in layer IV of primary somatosensory cortex). Top half, Initial versus overshoot signal phase. A, B, The peak location superimposed on an image of the maximum activity area for the initial dip from a representative rat is provided here (A, 1 mm scale grid applies to all images and is the same scale as for the grid used in the scatterplot), along with those of the overshoot in the same animal (B). C, The initial dip (+) and overshoot (black circle) peak locations are superimposed together on the same grid background to illustrate the spatial registry between the two. Note the ∼1 mm distance between the two peak locations. D, To summarize the spatial registry between the initial dip and overshoot peak locations across all 60 rats, the overshoot peak location was first converted to relative coordinates with respect to those of the initial dip such that a relative coordinate of (0,0) would indicate a perfect match in peak location for the two phases. Thus, a single rat can be plotted with a single point and a total of 60 rats can be summarized in a scatterplot. To better appreciate the anatomical significance of the variability in the plotted relative coordinates, the scatterplot is superimposed on an appropriately scaled schematic of tangential cortical layer IV cytochrome oxidase labeling that includes portions of primary somatosensory, visual (VI), and auditory (AI) cortex, with the relative origin centered above whisker C2 anatomical representation. Note that the overshoot peak location did not colocalize well with that of the initial dip; only 22% of the cases exhibited a margin of error that would still be considered to successfully lie above whisker C2 anatomical representation. E, The variability in the overshoot peak locations relative to the initial dip was further investigated relative to the large surface vessels by superimposing peak locations on a photograph of the imaged cortex for each rat. F, A summary is provided of the initial dip and overshoot peak locations categorized according to whether they fell on parenchyma, vein, artery, or dural artery. Note that the majority of the initial dip peak locations fell on parenchyma (57%) whereas the majority for the overshoot fell on a vein (53%), although examples from all of the different types of vasculature were observed for both signal phases. G, Despite the challenges associated with defining the centroid of an irregularly shaped activity area, an attempt was made to determine whether the center of the overshoot maximum activity area may colocalize better with the initial dip peak location. Note that in this particular example the center of the overshoot maximum area did not provide an obvious improvement in coregistering with the initial dip peak location (+). H, However, the center of the overshoot activity area when it initially appears may better coregister with the initial dip peak location, although in this particular example the margin of error (∼200 μm) is still approximately half the width of a large anatomical whisker representation. I–P, Initial versus undershoot signal phase. The overall findings were the same when comparing peak locations for the initial dip versus the undershoot signal phase.
Figure 9.
Figure 9.
Suprathreshold and subthreshold neuronal activity recorded through 13.5 s after onset of 1 s stimulus. Top half, Data from the supragranular layer at the initial dip peak location of a representative rat are provided to illustrate that suprathreshold (PSTH) and subthreshold (LFP) neuronal activity was followed for many seconds after stimulus delivery. Stimulus bars indicate the 1 s delivery of 5 Hz whisker C2 stimulation, and arrows indicate the approximate time after stimulus onset when area max is achieved for the intrinsic signal undershoot phase. Other than the obvious round of evoked suprathreshold and subthreshold neuronal activity occurring during stimulus delivery, note the lack of a second round of increased activity for both the PSTH and LFP for the interval between stimulus offset and up to 13.5 s after stimulus onset, including within a few seconds before the undershoot area-max time point. Bottom half, Control data from the same recording location in the same rat are provided to illustrate that no occurrences of spontaneous activity were observed with similar magnitudes as those of evoked activity for either the suprathreshold (PSTH) or subthreshold (LFP) recordings.
Figure 10.
Figure 10.
Comparing intrinsic signal imaged with 635 nm versus 605 nm illumination. Data from a representative rat is provided containing a total of 128 stimulation trials. Each were randomly interlaced and imaged within the same rat. As in Figure 1, images of poststimulus data shown here were created by first converting data into fractional change values relative to the baseline frame collected just before stimulus onset before applying a linear grayscale to the converted data. Also, an image of the prestimulus data were generated in a similar manner. Grayscale, 5 mm scale bar, and neuroaxis apply to all images. Line plot of the fractional change values was obtained from a single binned pixel located centrally within the imaged cortex, with the inset containing the same data points plotted upside down as is traditionally done in ISOI studies. Images have been scaled and displayed below the line plot for easier comparison along the time axis. Note that the triphasic nature of the evoked intrinsic signal is present when imaging with 605 nm as well as 635 nm illumination.

Similar articles

Cited by

References

    1. Ances BM. Coupling of changes in cerebral blood flow with neural activity: what must initially dip must come back up. J Cereb Blood Flow Metab. 2004;24:1–6. - PubMed
    1. Ances BM, Buerk DG, Greenberg JH, Detre JA. Temporal dynamics of the partial pressure of brain tissue oxygen during functional forepaw stimulation in rats. Neurosci Lett. 2001;306:106–110. - PubMed
    1. Arieli A, Shoham D, Hildesheim R, Grinvald A. Coherent spatiotemporal patterns of ongoing activity revealed by real-time optical imaging coupled with single-unit recording in the cat visual cortex. J Neurophysiol. 1995;73:2072–2093. - PubMed
    1. Biswal B, Yetkin FZ, Haughton VM, Hyde JS. Functional connectivity in the motor cortex of resting human brain using echo-planar MRI. Magn Reson Med. 1995;34:537–541. - PubMed
    1. Brett-Green BA, Chen-Bee CH, Frostig RD. Comparing the functional representations of central and border whiskers in rat primary somatosensory cortex. J Neurosci. 2001;21:9944–9954. - PMC - PubMed

Publication types