. 2007 Apr 25;27(17):4650-62.
doi: 10.1523/JNEUROSCI.4518-06.2007.

Extensive reorganization of primary afferent projections into the gustatory brainstem induced by feeding a sodium-restricted diet during development: less is more

Affiliations

Extensive reorganization of primary afferent projections into the gustatory brainstem induced by feeding a sodium-restricted diet during development: less is more

Jamie E Mangold et al. J Neurosci. .

Abstract

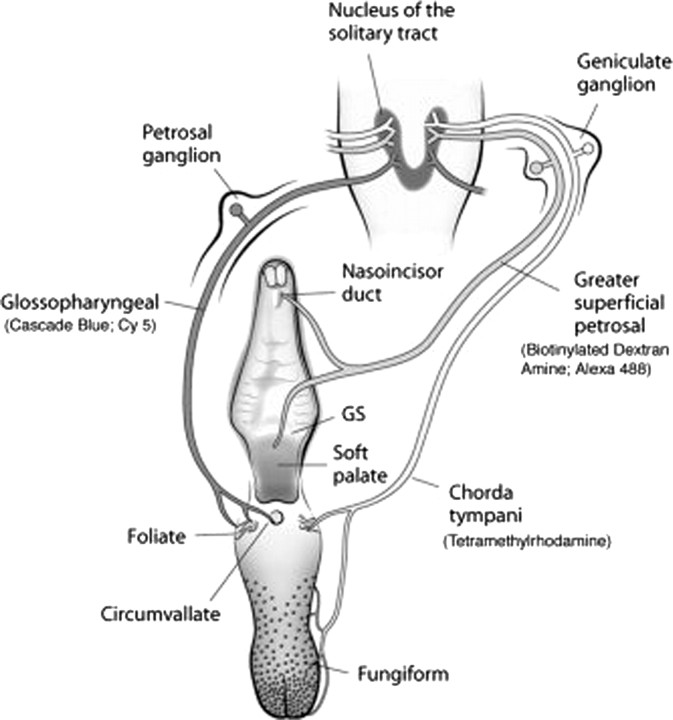
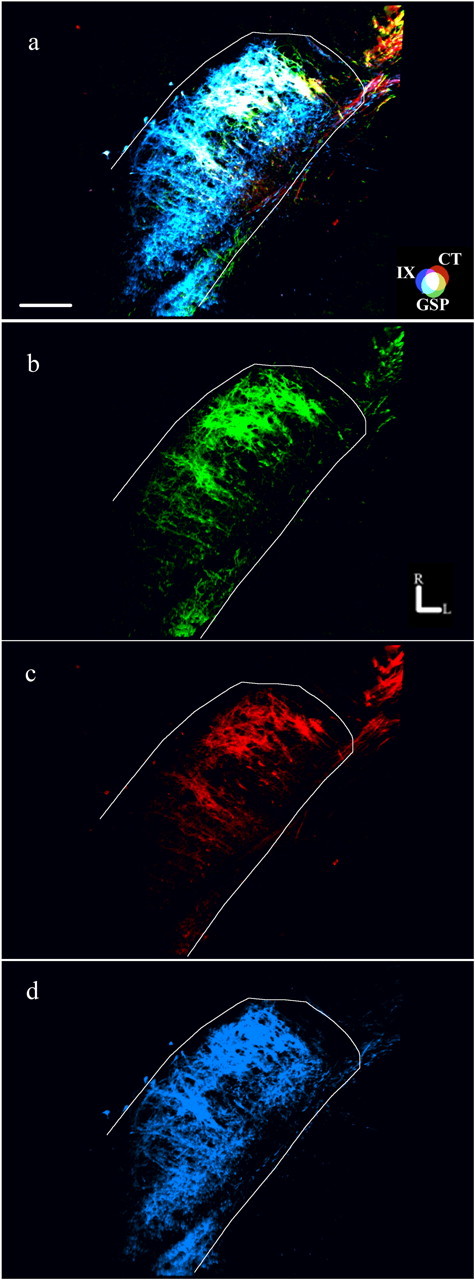
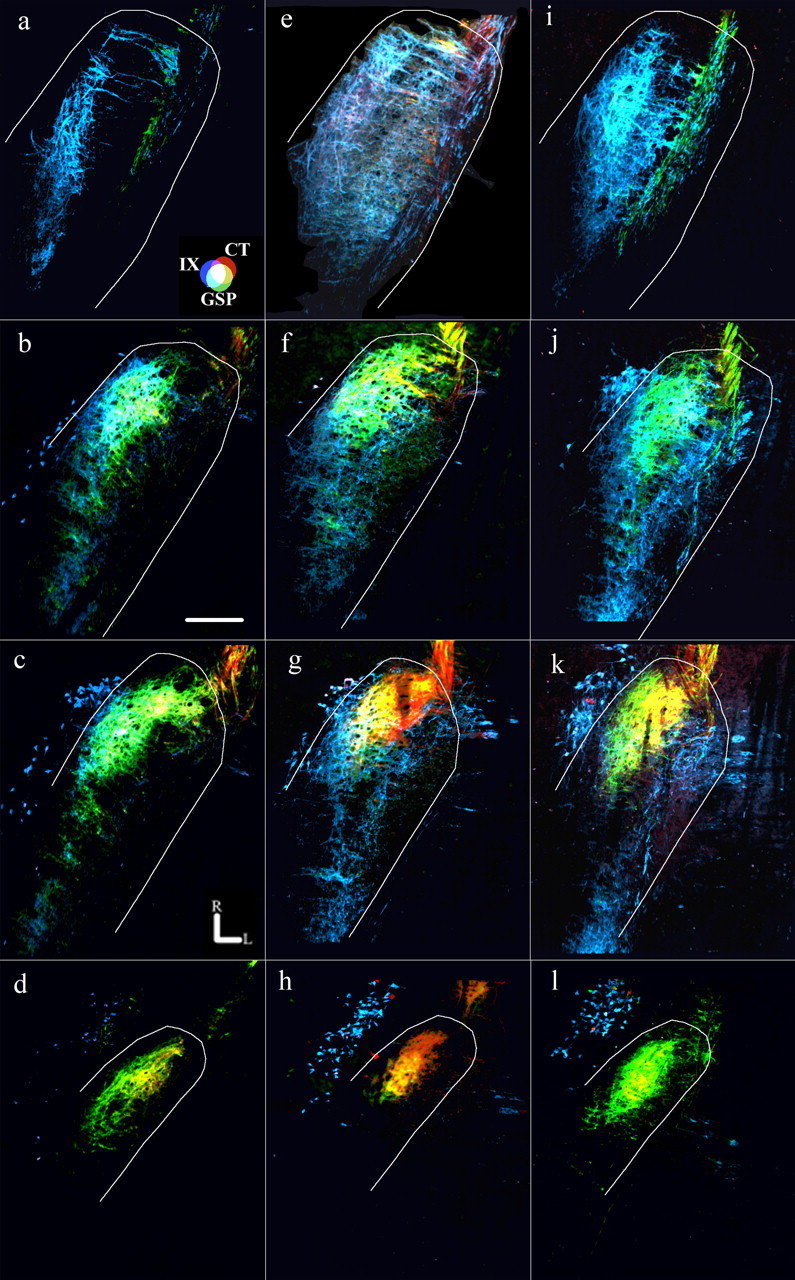
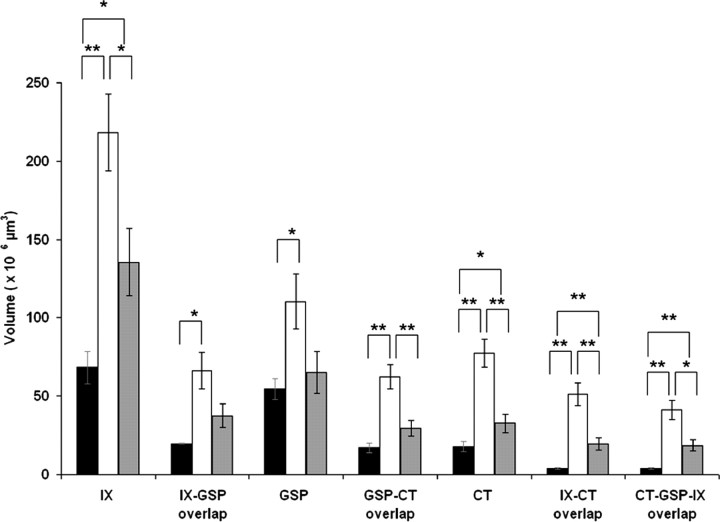
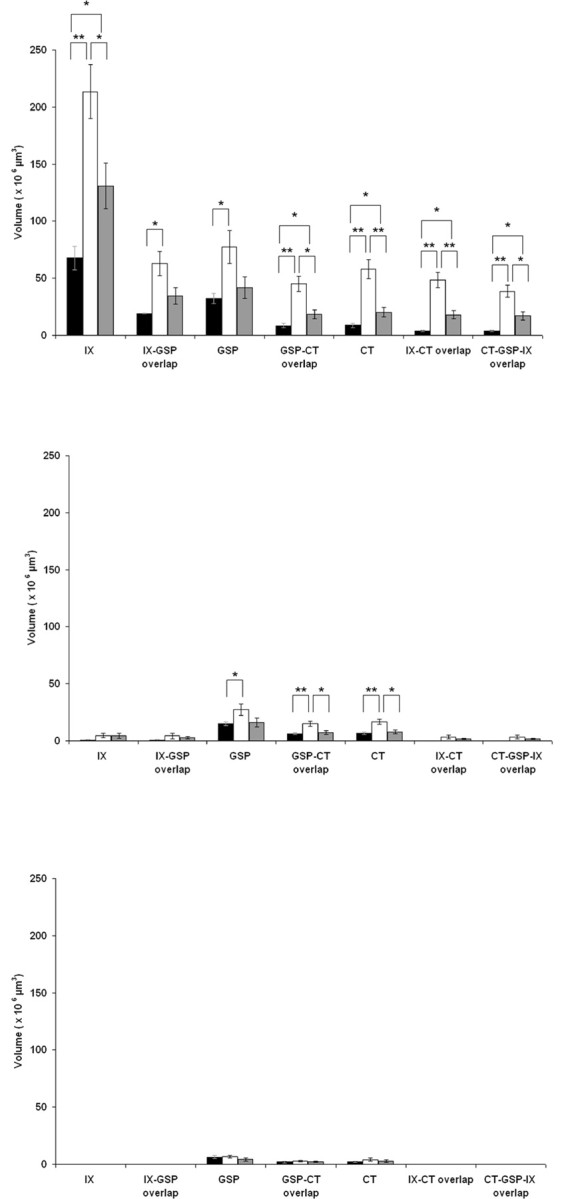
Neural development is especially vulnerable to environmental influences during periods of neurogenesis and rapid maturation. In fact, short periods of environmental manipulations confined to embryonic development lead to significant changes in morphology and function. A guiding principal emerging from studies of sensory systems is that experimentally induced effects are most dramatic in higher neural levels (e.g., cortex) and primarily involve postnatal synaptic refinements. In contrast to other sensory systems, the gustatory system is particularly susceptible to the effects of deprivation much earlier and with profound changes evident in the brainstem. Here we show that feeding pregnant rats a custom diet featuring a low-sodium content for 9 d before the tongue appears in the fetus produces extensive restructuring of the gustatory brainstem. Rats born to mothers fed the custom diet from embryonic day 3 (E3) to E12 have terminal field volumes of the greater superficial petrosal, chorda tympani, and glossopharyngeal nerves at adulthood that are expanded as much as 10 times beyond that found in rats fed a standard rat chow. The widespread alterations are not attributable to increased numbers of nerve cells, increased target size, or obvious changes in peripheral taste function. Moreover, we show that the limited period of feeding the custom diet has much larger effects than if rats were fed the diet to postweaning ages. Our results suggest that early periods of altered experience, especially during nucleus of the solitary tract neurogenesis, leads to a restructuring of the gustatory brainstem, which in turn may impact the control of sensory and homeostatic processes.


Figures

Figure 1.
Figure 1.
Anatomical organization of the peripheral gustatory system and the first central synaptic relay in the NTS. The CT nerve innervates taste buds in fungiform and foliate papillae on the anterior tongue. The GSP nerve innervates taste buds in the nasoincisor duct, the geschmacksstreifen (GS), and the soft palate. Both nerves make up the VII cranial nerve and have cell bodies in the geniculate ganglia. The IX nerve innervates taste buds in foliate and circumvallate papillae on the posterior tongue and has cell bodies in the petrosal ganglia. All three nerves terminate in the ipsilateral NTS; the IX nerve is shown at left only for illustrative purposes. The fluorescent markers used to detect each terminal field are noted in parentheses. See Materials and Methods for a detailed description. [The figure is adapted from May and Hill (2006).]
Figure 2.
Figure 2.
Components of fluorescent images used in analyses. Fluorescent photomicrographs showing the three merged terminal fields (a) and the component images of the GSP (green; b), CT (red; c), and IX (blue; d) terminal fields are shown. The approximate location of the NTS is outlined in white. The CT–GSP overlap is shown as yellow, the IX–GSP overlap is shown as blue-green, the IX–CT overlap is shown as magenta, and the CT–GSP–IX terminal field overlap is shown as white. Refer to the color guide in a. Rostral (R) and lateral (L) are indicated in b. Scale bar (in a), 200 μm.
Figure 3.
Figure 3.
Horizontal sections of merged images from dorsal through ventral sections in the rostral NTS. Fluorescent photomicrographs of rats fed the control diet (a–d), rats fed the sodium-restricted diet from E3 to E12 (e–h), and rats fed the sodium-restricted diet from E3 to P28 (i–l) are shown. The approximate location of the NTS is outlined in white. a, e, i, The most dorsal sections are characterized by the presence of the IX terminal field and GSP fibers in the solitary tract, except in rats fed the sodium-restricted diet from E3 to E12, where the CT terminal field can be seen (e). b, f, j, Dorsal sections contain all three terminal fields, with the most overlap occurring in rats fed the sodium-restricted diet from E3 to E12 (f). c, g, k, Intermediate sections are characterized by the densely labeled oval shape of the CT terminal field and retrogradely labeled cells of the salivatory nucleus, outside and medial to the NTS. Note that in both rats fed the restricted diet from E3 to E12 (g) and from E3 to P28 (k), the IX terminal field is present, whereas it normally does not project in rats fed the control diet (c). d, h, l, Ventral sections are characterized by the presence of the CT and GSP terminal fields and retrogradely labeled cells of the salivatory nucleus. See Results for a full description of zone determination. Nerve terminal field and overlap colors are the same as noted in Figure 2 and are shown on the color guide in a. Rostral (R) and lateral (L) are indicated in c. Scale bar (in b), 200 μm.
Figure 4.
Figure 4.
Mean total terminal field volumes. Bars denote the mean total volume (±SEM) of the terminal field and terminal field overlap of control (black bars), rats fed the sodium-restricted diet from E3 to E12 (white bars), and rats fed the restricted diet from E3 to P28 (gray bars). Note that the fields of overlap are inclusive within the total terminal field volume. *p < 0.05; **p < 0.01.
Figure 5.
Figure 5.
Myelin-stained brainstem sections from a rat fed the control diet. a–d illustrates the shape of the NTS and other brainstem structures at the respective dorsal-to-ventral level to the fluorescent images in Figure 3. The NTS is outlined in black, and black arrows point to the solitary tract. Rostral (R) and lateral (L) are indicated. 4V, Fourth ventricle; 12, hypoglossal nucleus; DCN, dorsal cochlear nucleus; icp, inferior cerebellar peduncle; Sp5, spinal trigeminal nucleus; sp5, spinal trigeminal tract; VCN, ventral cochlear nucleus. Scale bar (in a), 1 mm.
Figure 6.
Figure 6.
Three-dimensional representation of the three primary afferent terminal fields in the NTS of rats fed the control diet from a dorsal (a) and a lateral (b) view. Terminal fields and overlap of fields are shown with respect to the NTS. The CT terminal field is shown in red, the GSP terminal field is shown in green, the IX terminal field is shown in blue, and the NTS is shown in gray. Note the rostral positions of the terminal fields relative to the entire NTS. This figure does not reproduce actual data; it is a representation of what is typically seen in an adult rat fed the control diet. Rostral (R), lateral (L), and ventral (V) are indicated.
Figure 7.
Figure 7.
Mean zonal terminal field volumes. Zonal distribution of mean (±SEM) terminal field volumes of the GSP, CT, and IX nerves and corresponding overlap in the NTS of rats fed the control diet (black bars), rats fed the sodium-restricted diet from E3 to E12 (white bars), and rats fed the sodium-restricted diet from E3 to P28 (gray bars) are shown. Top, Dorsal zone; middle, intermediate zone; bottom, ventral zone. The most dramatic increases in terminal field volume in both experimental groups are contained within the dorsal zone. *p < 0.05; **p < 0.01.
Figure 8.
Figure 8.
Terminal fields within subdivisions of the NTS. Coronal sections through the rat medulla in rats fed the control diet (a–f) and rats fed the sodium-restricted diet from E3 to E12 (g–l) and from E3 to P28 (m–r) show the terminal field for the GSP (a, g, m), CT (b, h, n), and IX (c, i, o) nerves. d, j, p, Merged terminal fields. e, k, q, Merged image superimposed on an image of the brainstem obtained through the transmitted light channel on the confocal laser microscope system. f, l, r, Nissl-stained tissue illustrating the location of the NTS relative to other brainstem structures. Lines in e, f, k, l, q, and r demarcate the approximate boundaries of the subdivisions in the NTS as described by Halsell et al. (1996). h, i, k, Note that the CT terminal field in rats fed the sodium-restricted diet from E3 to E12 invades inappropriate NTS subnuclei. Refer to the color guide in d to identify individual fields and overlap among different terminal fields. Scale bars: (in p) a–d, g–j, m–p, 200 μm; (in k), e, k, g, 200 μm; (in f) f, l, r, 500 μm. T, Solitary tract; M, medial subdivision of the NTS; RC, rostrocentral subdivision of the NTS; V, ventral subdivision of the NTS; RL, rostrolateral subdivision of the NTS; 4V, fourth ventricle; DPGi, dorsal paragigantocellular nucleus; MVeMC, medial vestibular nucleus magnocellular; MVePC, medial vestibular nucleus parvocellular; Pr, principal nucleus; SpVe, spinal vestibular nucleus.
Figure 9.
Figure 9.
The IX terminal field in the spinal trigeminal nucleus. The IX terminal field is shown in blue and overlayed on a transmitted light image of a horizontal section through the lateral medulla. Both images were acquired at 10× magnification. Mo5, Motor trigeminal nucleus; Pr5VL, principal sensory nucleus, ventrolateral; Pr5DM, principal sensory nucleus, dorsomedial; sp5O, spinal trigeminal nucleus, oral; sp5I, spinal trigeminal nucleus, interpolar; sp5, spinal trigeminal tract; VCA, ventral cochlear nucleus, anterior. Rostral (R) and lateral (L) are indicated. Scale bar, 200 μm.
Figure 10.
Figure 10.
Neurophysiological taste responses to NaCl. Mean (±SEM) response–concentration functions from the whole CT nerve in adult rats fed the control diet (filled line, filled circles) and rats fed the sodium-restricted diet from E3 to E12 (dashed line, open squares) are shown. Responses are also shown for the CT nerve in rats fed the sodium-restricted diet from E3 through adulthood [short dashed line, open diamonds; data taken from Hill (1987)] to show the attenuated NaCl response in rats fed the sodium-restricted diet from E3 to P28 at the time of sodium repletion. At adulthood, rats fed the sodium-restricted diet from E3 to E12 had similar taste responses as rats fed the control diet and much different than rats sodium restricted throughout development.
Figure 11.
Figure 11.
Summary model of terminal field organization. A model of terminal field organization through the dorsoventral extent of horizontal sections from the right NTS in rats fed the control diet (left column), rats fed the sodium-restricted diet from E3 to E12 (middle column), and rats fed the sodium-restricted diet from E3 to P28 (right column). Overlapping fields are represented at four levels along the dorsoventral axis. Note that there are dorsal sections that contain the terminal field in rats fed the sodium-restricted diet from E3 to E12 that are not present in the other two groups. See Results for details of the overlap among the three fields and a comparison of diet-related differences. Refer to the color key to identify individual fields among different terminal fields. Inclusion of a colored figure within another denotes overlap among the multiple terminal fields. Note that because of the orientation of the NTS within the brainstem, the term dorsal section refers to dorsocaudal, and ventral refers to ventrorostral, as depicted in Figure 6.

Similar articles

Cited by

References

    1. Altman J, Bayer S. Development of the cranial nerve ganglia and related nuclei in the rat. Adv Anat Embryol Cell Biol. 1982;74:1–90. - PubMed
    1. Barker DJ. Maternal nutrition, fetal nutrition, and disease later in life. Nutrition. 1997;13:807–813. - PubMed
    1. Barker DJ. The malnourished baby and infant. Br Med Bull. 2001;60:69–88. - PubMed
    1. Bradley RM. Boca Raton, FL: CRC/Taylor and Francis Group; 2007. The role of the nucleus of the solitary tract in gustatory processing. - PubMed
    1. Bradley RM, Grabauskas G. Neural circuits for taste. Excitation, inhibition, and synaptic plasticity in the rostral gustatory zone of the nucleus of the solitary tract. Ann NY Acad Sci. 1998;855:467–474. - PubMed

Publication types

MeSH terms

Substances