. 2007 Apr 25;27(17):4674-86.
doi: 10.1523/JNEUROSCI.5365-06.2007.

Differential regulation of AMPA receptor trafficking by neurabin-targeted synaptic protein phosphatase-1 in synaptic transmission and long-term depression in hippocampus

Affiliations

Differential regulation of AMPA receptor trafficking by neurabin-targeted synaptic protein phosphatase-1 in synaptic transmission and long-term depression in hippocampus

Xiao-dong Hu et al. J Neurosci. .

Abstract

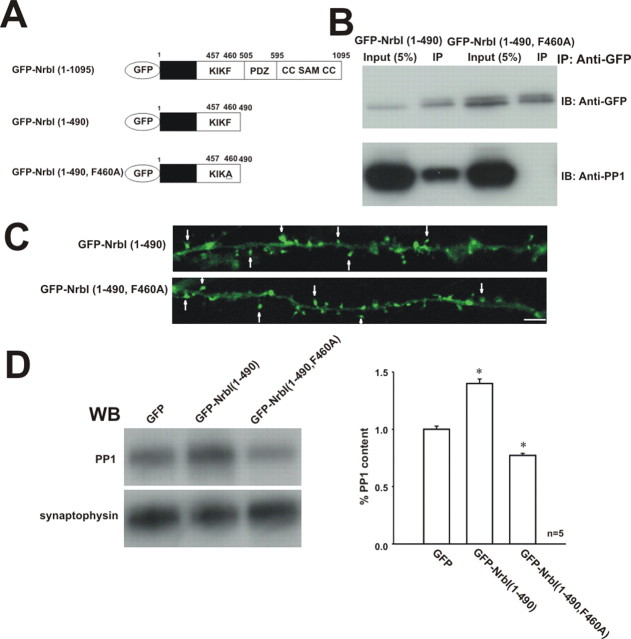
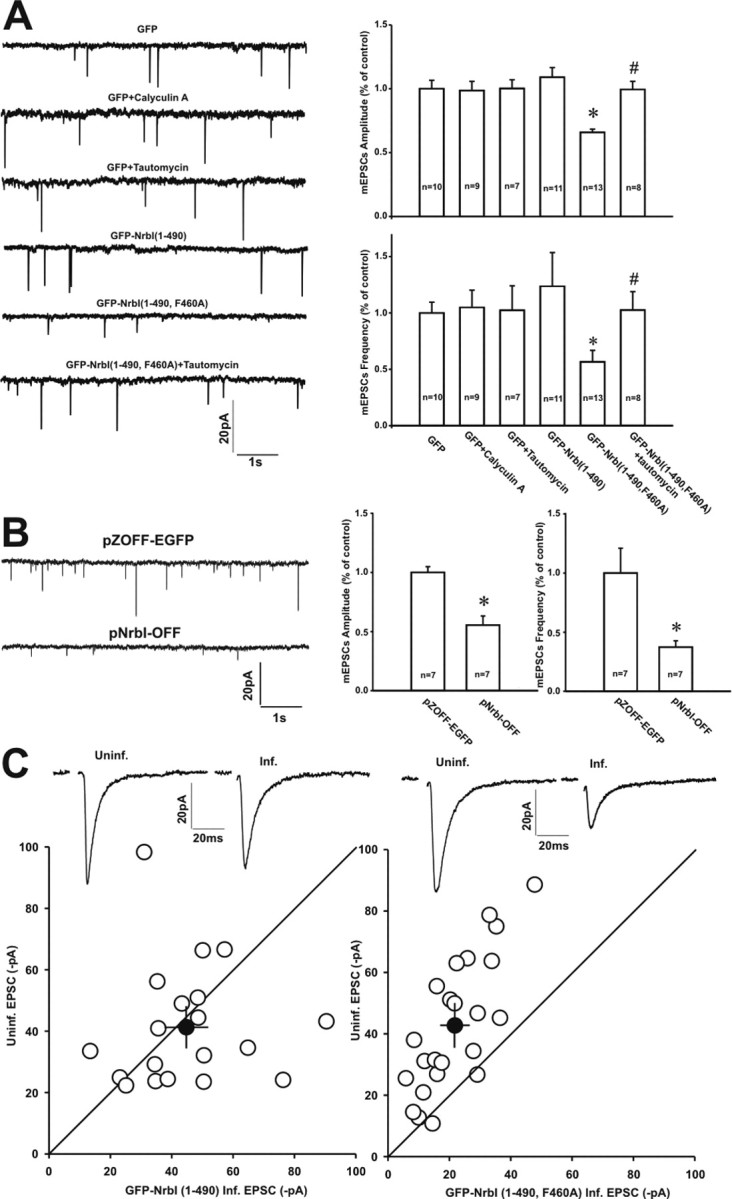
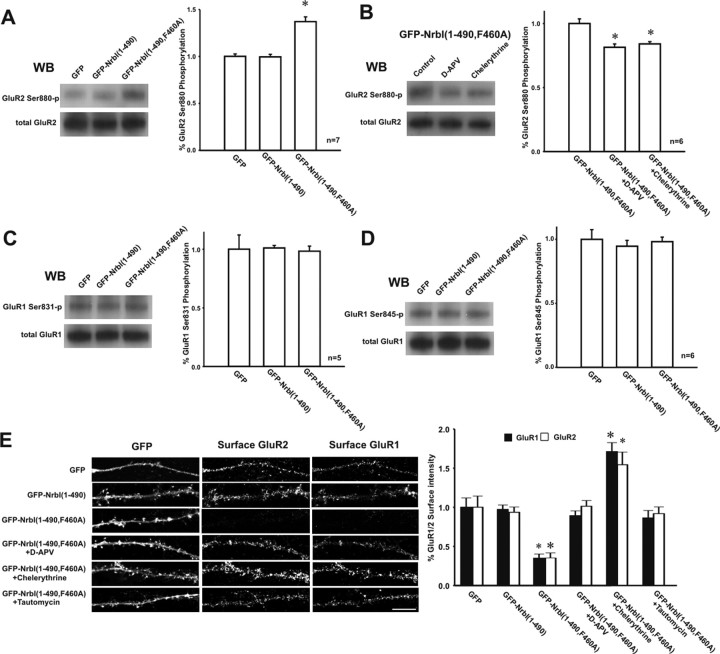
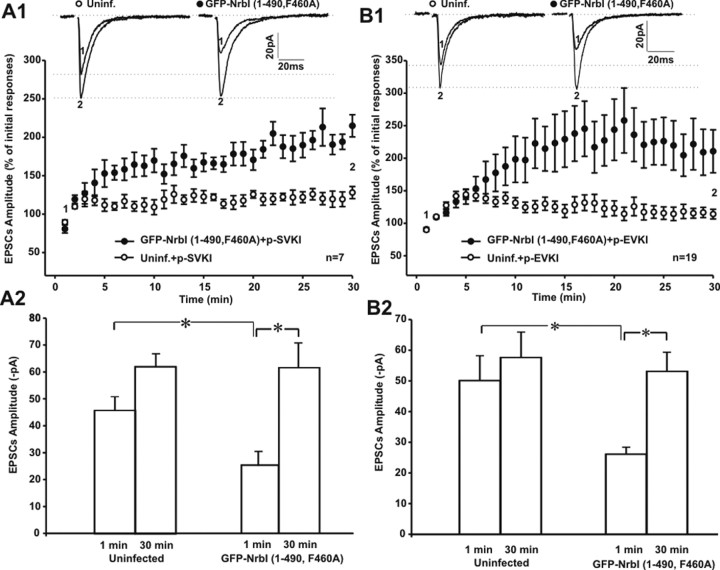
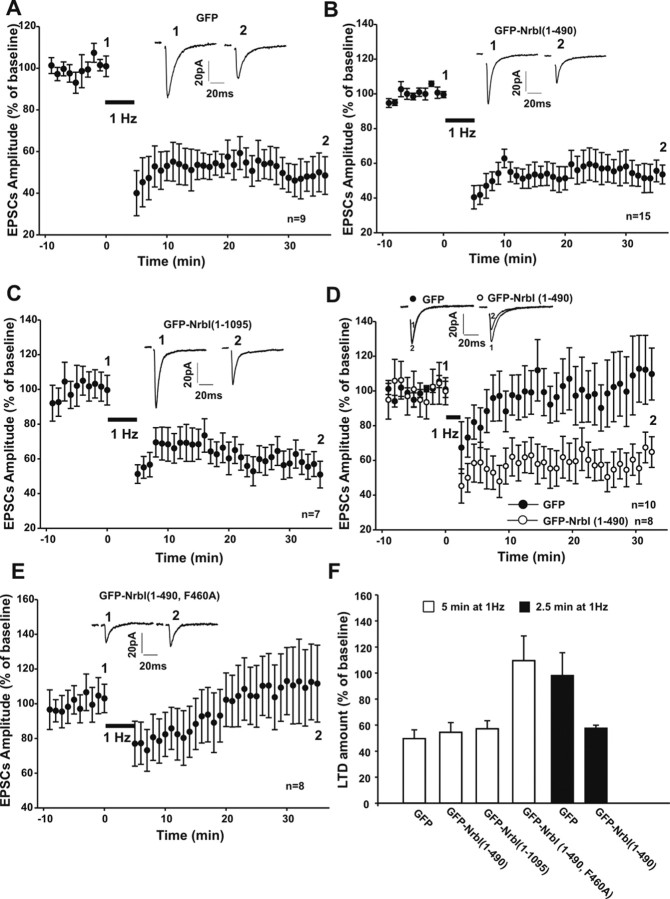
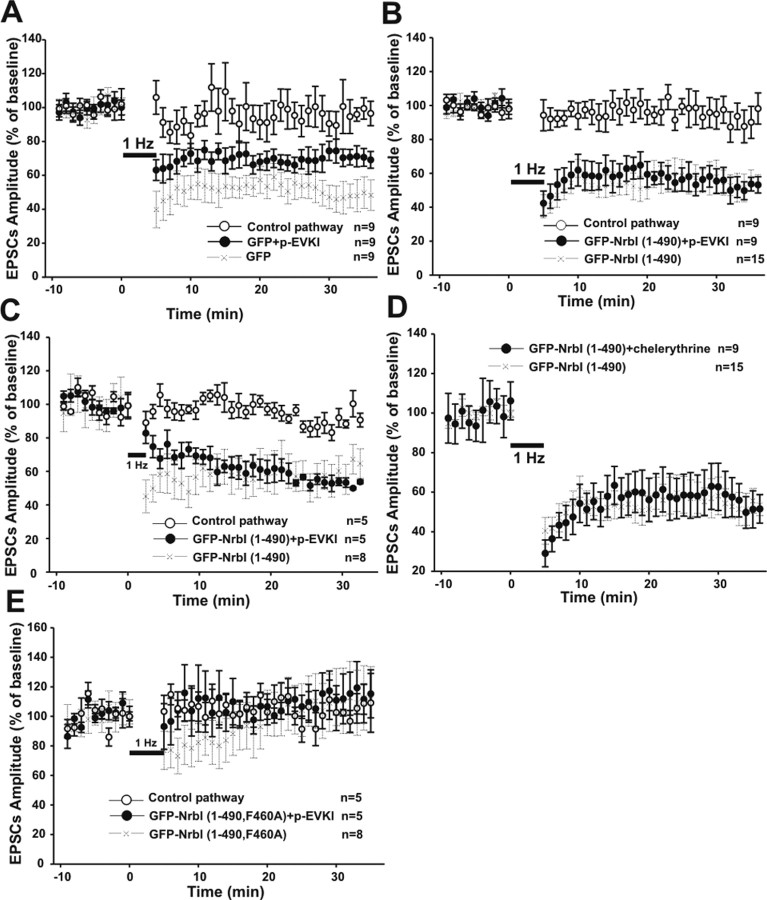
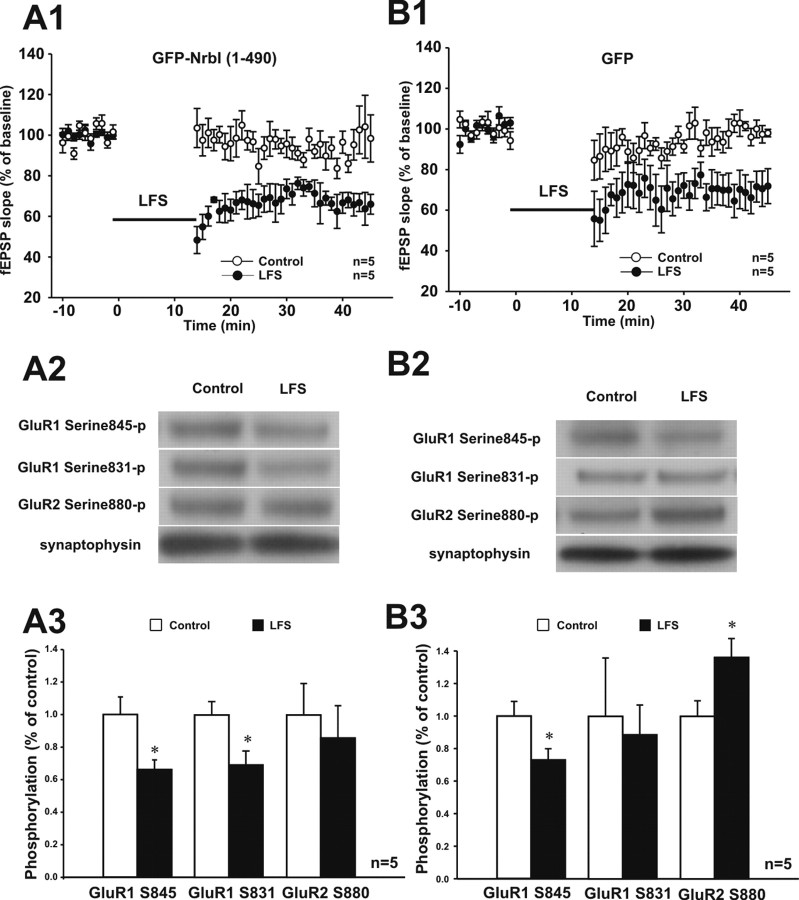
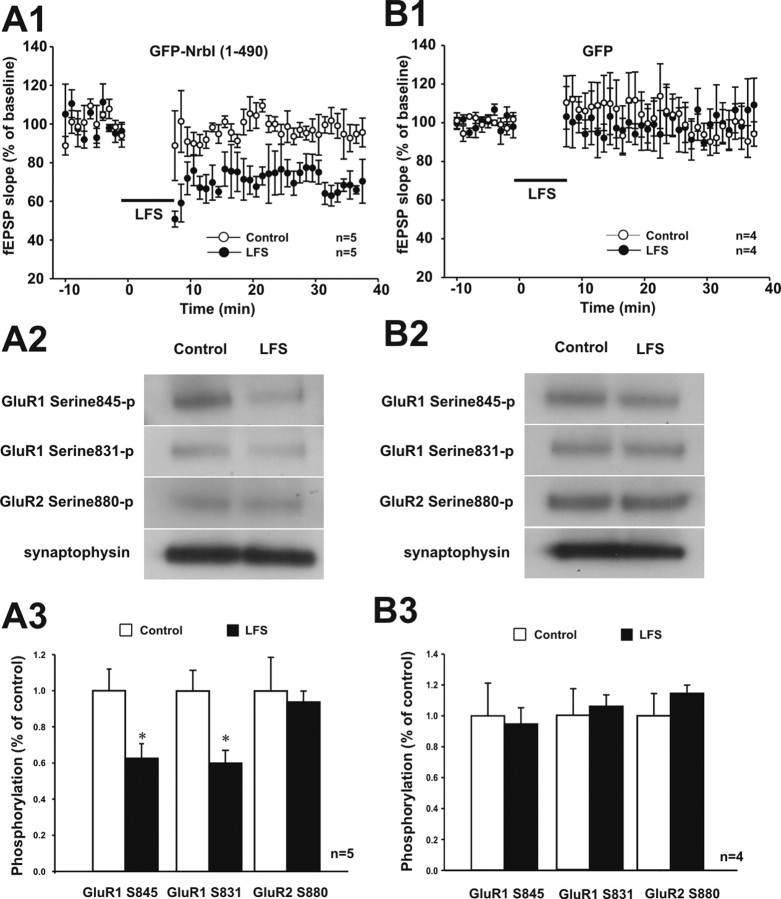
Filamentous actin binding protein neurabin I (NrbI) targets protein phosphatase-1 (PP1) to specific postsynaptic microdomains, exerting critical control over AMPA receptor (AMPAR)-mediated synaptic transmission. NrbI-targeted synaptic PP1, which promotes synaptic depression upon long-term depression (LTD) stimuli, serves to prevent synaptic depression under basal conditions. The present studies investigate this opposite regulation of AMPAR trafficking during basal synaptic transmission and LTD by expressing NrbI or NrbI mutant, which is defective in PP1 binding, in hippocampal slice or neuron cultures. We find that expression of the NrbI mutant to interfere with PP1 targeting dramatically reduces basal synaptic transmission, which is correlated with the reduction in surface expression of AMPA subtype glutamate receptor (GluR) 1 and GluR2 subunits. Biochemical analysis demonstrates that the NrbI mutant selectively increases the phosphorylation of GluR2 at C-terminal consensus PKC site, serine 880, which is known to favor GluR2 interaction with PDZ (postsynaptic density 95/Discs large/zona occludens 1) protein PICK1 (protein interacting with C kinase-1). Inhibition of PKC activity or GluR2-PICK1 interaction completely reverses the synaptic depression in neurons expressing the NrbI mutant, suggesting that NrbI-targeted synaptic PP1 stabilizes the basal transmission by negatively controlling PKC phosphorylation of GluR2 and the subsequent PICK1-mediated decrease in GluR2-containing AMPAR surface expression. Distinct from basal transmission, blocking GluR2-PICK1 interaction or PKC activity produces minimal effects on LTD in NrbI-expressing neurons. Instead, NrbI-targeted PP1 facilitates LTD by dephosphorylating GluR1 at both serine 845 and serine 831, with GluR2 serine 880 phosphorylation unaltered. Our studies thus elucidate that NrbI-targeted PP1, in response to distinct synaptic activities, regulates the synaptic trafficking of specific AMPAR subunits.


Figures

Figure 1.
Figure 1.
NrbI targeted PP1 to dendritic spines via its N terminus. A, Schematics of NrbI polypeptides analyzed in this study. Wild-type NrbI (1095 amino acids), fused with GFP at its N terminus, has an F-actin-binding domain (black), PP1-binding motif (KIKF), PDZ homology domain, coiled-coil (CC) domain, and sterile α motif (SAM). GFP-tagged truncated NrbI (1–490) and NrbI (1–490, F460A), in which phenylalanine 460 was substituted with alanine, were also shown. B, NrbI associated with PP1 via PP1 binding motif. HEK293 cells were transfected with cDNAs encoding GFP–NrbI (1–490) or GFP–NrbI (1–490, F460A). The protein extracts were immunoprecipitated (IP) with anti-GFP antibodies. Immunoprecipitates were subjected to SDS-PAGE and immunoblotting (IB) with anti-GFP and anti-PP1 antibodies. Note that GFP–NrbI (1–490, F460A) did not bind to PP1. C, Both GFP–NrbI (1–490) (top) and GFP–NrbI (1–490, F460A) (bottom) were concentrated at dendritic spines (marked by arrows) in CA1 pyramidal cells from organotypic hippocampal slice cultures. Scale bar, 5 μm. D, Expression of GFP–NrbI (1–490) increased, whereas GFP–NrbI (1–490, F460A) decreased, the PP1 concentration in synaptoneurosome fraction from hippocampal slice cultures. Left, Western blots of PP1 in synaptoneurosome from slices infected with GFP, GFP–NrbI (1–490), or GFP–NrbI (1–490, F460A). Equal protein loadings were indicated by immunoblotting of synaptophysin. Right, Graph showed the mean percentage changes of PP1 concentration in synaptoneurosome. The relative amount of PP1 was determined by the ratio of PP1 signals to synaptophysin signals. These ratios were normalized to the control (GFP) value. *p < 0.05 when compared with GFP-infected slices.
Figure 2.
Figure 2.
Disruption of PP1 binding to NrbI decreased the basal synaptic transmission. A, GFP–NrbI (1–490, F460A), which contained a point mutation in the core PP1 binding motif to abolish PP1 binding, decreased the frequency and amplitude of mEPSCs recorded in CA1 pyramidal neurons in organotypic hippocampal slice cultures. Left, Sample traces of mEPSCs recorded in neurons expressing GFP, GFP–NrbI (1–490), or GFP–NrbI (1–490, F460A). Note that pretreatment of GFP-expressing neurons with PP1 inhibitor tautomycin (10 μm) or calyculin A (1 μm) had no effects on mEPSCs. However, tautomycin increased the frequency and amplitude of mEPSCs in GFP–NrbI (1–490, F460A)-expressing neurons. Right, Graph showed the mean percentage changes in the mEPSCs amplitude (top) and frequency (bottom). *, #p < 0.05 when compared with neurons expressing GFP (*) or GFP–NrbI (1–490, F460A) (#). B, Primary cultured hippocampal neurons transfected with pNrbI–OFF that coexpressed shRNA against NrbI along with EGFP to knockdown endogenous NrbI displayed significant decrease in the amplitude and frequency of mEPSCs relative to those transfected with pZOFF–EGFP that expressed EGFP alone. Left, Sample traces of mEPSCs recorded in neurons expressing pZOFF–EGFP (top) and pNrbI–OFF (down). Right, Graph showed the mean percentage changes in the mEPSC amplitude and frequency. C, Disruption of NrbI-mediated PP1 targeting depressed the evoked basal synaptic transmission in CA1 pyramidal neurons in hippocampal slice cultures. Left, Pairwise comparison of synaptic response amplitudes between GFP–NrbI (1–490)-expressing neurons and neighboring uninfected neurons in the same slice. Right, Summary data of pairwise comparisons of synaptic response amplitudes between GFP–NrbI (1–490, F460A)-expressing neurons and neighboring uninfected neurons. Averaged sample traces of synaptic transmission on an uninfected cell (Uninf.) and an adjacent infected cell (Inf.) from a pairwise experiment were also shown at the top of each panel.
Figure 3.
Figure 3.
The synaptic depression in neurons expressing GFP–NrbI (1–490, F460A) was prevented by the NMDA receptor antagonist d-APV and high concentration of Mg2+. Hippocampal slice cultures were incubated in the culture medium containing d-APV (100 μm) or Mg2+ (10 mm) immediately after injection of Sindbis virus encoding GFP–NrbI (1–490, F460A). A, B, Pairwise comparison of synaptic transmission on uninfected and in-slice adjacent infected cells in the presence of d-APV (A) and high Mg2+ (B). Averaged sample traces from an uninfected (Uninf.) and an infected (Inf.) neuron in the same slice were shown on the right side of each panel.
Figure 4.
Figure 4.
The synaptic depression in neurons expressing GFP–NrbI (1–490, F460A) that interfered with PP1 synaptic targeting was selectively prevented by the PKC inhibitor chelerythrine (5 μm) but not by the CaMKII inhibitor KN-62 (5 μm) or the PKA inhibitor Rp-cAMP (50 μm). A, Left, Summary data of pooled amplitudes of synaptic transmission on GFP–NrbI (1–490, F460A)-expressing neurons and in-slice adjacent control neurons from slices pretreated with chelerythrine for 2–4 h before recordings. Chelerythrine (5 μm) was also included in the recording pipettes. Right, Average sample traces from a GFP–NrbI (1–490, F460A)-expressing neuron (Inf.) and an adjacent uninfected control neuron (Uninf.) in the same slice. B, C, Pairwise comparison of synaptic response amplitudes between GFP–NrbI (1–490, F460A)-expressing neurons and neighboring uninfected neurons in the presence of KN-62 (B) and Rp-cAMP (C). Insets, Representative synaptic responses obtained from a pair of uninfected and infected neurons in each panel.
Figure 5.
Figure 5.
GFP–NrbI (1–490, F460A), which interfered with PP1 synaptic targeting, specifically increased the phosphorylation of AMPA receptor GluR2 subunits at Ser880 and decreased the surface expression of GluR2-containing AMPARs in primary cultured hippocampal neurons, which could be prevented by the NMDA receptor antagonist d-APV and the protein kinase C inhibitor chelerythrine. A, Expression of GFP–NrbI (1–490, F460A) significantly increased the phosphorylation of GluR2 at Ser880. Left, Western blots (WB) of GluR2 Ser880 phosphorylation using anti-Ser880 phospho-specific antibody. The equal protein loading was verified by immunoblotting with the antibody against GluR2 C terminus. Right, Graph showed the percentage changes in the phosphorylation level of GluR2 Ser880 in neurons expressing GFP, GFP–NrbI (1–490), and GFP–NrbI (1–490, F460A). The relative amount of phosphorylated GluR2 at Ser880, expressed by the ratio of phosphorylation signals to total GluR2 signals, was normalized to the control (GFP) value. *p < 0.05 when compared with GFP-expressing neurons. B, Pretreatment of GFP–NrbI (1–490, F460A)-expressing neurons with d-APV (100 μm) or chelerythrine (5 μm) decreased the phosphorylation level of GluR2 Ser880. *p < 0.05 when compared with GFP–NrbI (1–490, F460A)-expressing neurons. C, D, Expression of GFP–NrbI (1–490, F460A) did not increase the phosphorylation of AMPA receptor GluR1 subunits at either Ser831 (C) or Ser845 (D). E, Expression of GFP–NrbI (1–490, F460A) decreased the surface expression of GluR2-containing AMPARs. Left, Surface GluR2 and GluR1 were labeled with antibodies against the extracellular N terminus of GluR2 and GluR1 under impermeable conditions before fixation and immunostaining with second antibodies in cultured hippocampal neurons transfected with GFP, GFP–NrbI (1–490), or GFP–NrbI (1–490, F460A). GluR2 and GluR1 staining in the presence of d-APV, chelerythrine, and tautomycin (10 μm) was also shown in GFP–NrbI (1–490, F460A)-expressing neurons. Scale bar, 5 μm. Right, Quantitative analysis of GluR2 and GluR1 surface immunostaining intensity. *p < 0.05 when compared with GFP-expressing neurons; n > 14 for each condition.
Figure 6.
Figure 6.
Intracellular infusion of synthetic peptides KKEGYNVYGIESVKI (p-SVKI) and KKEGYNVYGIEEVKI (p-EVKI) rescued the synaptic depression in neurons expressing GFP–NrbI (1–490, F460A). A, p-SVKI corresponded to the extreme cytoplasmic C terminus of GluR2, which disrupted GluR2 interaction with PDZ proteins, including PICK1. The extent to which p-SVKI (200 μm) increased the synaptic transmission in cells expressing GFP–NrbI (1–490, F460A) (filled circles) was more than that in adjacent uninfected (Uninf.) control cells (open circles). The normalized amplitudes of synaptic responses were plotted versus time (A1). Insets, Sample traces recorded in an uninfected (left) neuron and a neighboring infected (right) neuron were obtained at the time points indicated by 1 and 2. Histogram showed the mean amplitudes of synaptic transmission on neurons expressing GFP–NrbI (1–490, F460A) and adjacent control neurons at 1 min and 30 min after p-SVKI infusion (A2). B, p-EVKI (200 μm), which corresponded to the extreme C terminus of GluR2 except for a point mutation that mimicked the phosphorylation of GluR2 at serine 880 to selectively disrupt GluR2–PICK1 interaction, also increased the synaptic transmission to a greater extent in cells expressing GFP–NrbI (1–490, F460A) (filled circles) than in adjacent uninfected (Uninf.) control cells (open circles). The normalized amplitudes of synaptic responses were plotted versus time (B1). Insets, Sample traces recorded in an uninfected (left) neuron and a neighboring infected (right) neuron were obtained at the time points indicated by 1 and 2. Histogram showed the mean amplitudes of synaptic transmission on neurons expressing GFP–NrbI (1–490, F460A) and adjacent control neurons at 1 min and 30 min after p-EVKI infusion (B2). Asterisks indicate the groups between which the mean amplitudes were significantly different (p < 0.05).
Figure 7.
Figure 7.
NrbI-targeted synaptic PP1 facilitated LTD induction in hippocampal slice cultures. A, Pairing presynaptic stimulation at 1 Hz for 5 min with postsynaptic neurons held at −45 mV stably induced LTD in GFP-expressing neurons. Normalized mean synaptic responses before and after LTD stimuli were plotted versus time. The horizontal bar indicated the period of pairing stimuli. Insets, Sample traces were taken at the time points indicated by the 1 and 2. B, C, The pairing stimuli protocol as described above induced LTD in neurons expressing GFP–NrbI (1–490) that lacked the C terminus (B) or full-length GFP–NrbI (1–1095) (C). D, Suboptimal stimuli protocol (1 Hz for 2.5 min) induced robust LTD in GFP–NrbI (1–490)-expressing neurons (open circles), which, however, failed to do so in GFP-expressing neurons (filled circles). E, Interference with PP1 synaptic targeting by expression of GFP–NrbI (1–490, F460A) completely blocked the LTD induction after 5 min pairing stimuli. F, The graph showed the percentage changes in EPSC amplitudes within the last 10 min of recordings in each transfection in response to pairing stimuli for 5 min (open bars) or 2.5 min (suboptimal LTD-inducing stimuli; filled bars).
Figure 8.
Figure 8.
Intracellular perfusion of GluR2 C-terminal peptide (KKEGYNVYGIEEVKI; p-EVKI) that selectively disrupted GluR2–PICK1 interaction attenuated LTD in GFP-expressing neurons but not in GFP–NrbI (1–490)-expressing neurons. The pairing LTD-inducing stimuli (1 Hz for 5 min with postsynaptic neurons held at −45 mV) were delivered to the test pathway at 30 min after break in, a time point at which the peptide in the recording electrodes had fully diffused into the dendrites and the increase in the synaptic transmission had reached a plateau. A, Intracellular infusion of p-EVKI partially blocked LTD in GFP-expressing neurons in the test pathway (filled circles). In the control pathway to which no pairing stimuli were delivered, the EPSCs amplitudes remained stable in the presence of the peptide during the course of recordings (open circles). For comparison purposes, the percentage changes of EPSC amplitudes after LTD-inducing stimuli in GFP-expressing neurons not loaded with the peptide were also shown (dashed × symbols). B, Perfusion of p-EVKI in GFP–NrbI (1–490)-expressing neurons produced minimal effects on LTD magnitudes in the test pathway (filled circles). The EPSC amplitudes in the control pathway (open circles) changed little in the presence of p-EVKI during the course of recordings. For comparison purposes, the percentage changes of EPSC amplitudes after LTD-inducing stimuli in GFP–NrbI (1–490)-expressing neurons not loaded with the peptide were also shown (dashed × symbols). C, Suboptimal LTD-inducing stimuli (2.5 min instead of 5 min) also elicited robust LTD in GFP–NrbI (1–490)-expressing neurons loaded with p-EVKI (filled circles). For comparison purposes, the percentage changes of EPSC amplitudes in response to suboptimal stimuli were also shown in GFP–NrbI (1–490)-expressing neurons not loaded with the peptide (dashed × symbols). D, The protein kinase C inhibitor chelerythrine (5 μm) did not block LTD in GFP–NrbI (1–490)-expressing neurons. For comparison purposes, the percentage changes of EPSC amplitudes after LTD-inducing stimuli in GFP–NrbI (1–490)-expressing neurons not treated with chelerythrine were also shown (dashed × symbols). E, Expression of GFP–NrbI (1–490, F460A) blocked LTD even if p-EVKI had rescued the depressed synaptic transmission in the test pathway (filled circles). The control pathway (open circles) displayed stable EPSC amplitudes in the presence of p-EVKI during the course of recordings. For comparison purposes, the percentage changes of EPSC amplitudes after LTD stimuli were also shown in GFP–NrbI (1–490, F460A)-expressing neurons not loaded with the peptide (dashed × symbols).
Figure 9.
Figure 9.
Standard LTD-inducing stimuli in GFP-NrbI (1–490)-infected hippocampal slices reduced the phosphorylation of AMPA receptor GluR1 subunits at serine 845 and serine 831. Two hippocampal slices were put in the same recording chamber: one receiving low-frequency stimuli (LFS) (1 Hz for 15 min; LFS slice) and the other not (control slice). After recordings of the extracellular field EPSP (fEPSP), the phosphorylation of AMPA receptor subunits was detected by immunoblotting with phosphorylation site-specific antibodies against GluR1 serine 845, GluR1 serine 831, and GluR2 serine 880. A, GFP–NrbI (1–490)-infected hippocampal slices displayed robust LTD after low-frequency stimuli (A1; filled circles). GFP–NrbI (1–490)-infected control slice exhibited stable field EPSP slopes during the whole course of recordings (A1; open circles). The phosphorylation levels of GluR1 at serine 845 and serine 831 significantly decreased in low-frequency stimuli slices compared with those in control slices (A2, A3; *p < 0.05). GluR2 phosphorylation at serine 880 had no difference between low-frequency stimuli slices and control slices (A2, A3). The equal protein loadings were verified by immunostaining of synaptophysin. B, Low-frequency stimuli induced LTD in GFP-infected slices (B1; filled circles) compared with GFP-infected control slices (open circles). LTD in GFP-infected slices was coincident with the dephosphorylation of GluR1 at serine 845 but not at serine 831 (B2, B3). The phosphorylation level of GluR2 at serine 880 significantly increased after low-frequency stimulation (B2, B3).
Figure 10.
Figure 10.
Suboptimal LTD-inducing stimuli in GFP–NrbI (1–490)-infected hippocampal slices reduced the phosphorylation of AMPA receptor GluR1 subunits at serine 845 and serine 831. Two hippocampal slices were put in the same recording chamber: one receiving suboptimal LTD-inducing stimuli [1 Hz for 7.5 min; low-frequency stimuli (LFS) slice] and the other not (control slice). After recordings of the extracellular field EPSP (fEPSP), the phosphorylation of AMPA receptor subunits was detected by immunoblotting with phosphorylation site-specific antibodies against GluR1 serine 845, GluR1 serine 831, and GluR2 serine 880. A, GFP–NrbI (1–490)-infected hippocampal slices displayed robust LTD after suboptimal low-frequency stimulation (A1; filled circles), whereas control slices exhibited stable field EPSP slopes during the whole course of recordings (A1; open circles). The phosphorylation levels of GluR1 at serine 845 and serine 831 significantly decreased in low-frequency stimuli slices compared with those in control slices (A2, A3; *p < 0.05). GluR2 phosphorylation at serine 880 had no difference between LFS slices and control slices (A2, A3). The equal protein loadings were indicated by immunostaining of synaptophysin. B, GFP-infected slices failed to express LTD after suboptimal low-frequency stimulation (B1; filled circles). The control slices exhibited stable field EPSP slopes during the whole course of recordings (B1; open circles). B2, B3, The phosphorylation of GluR1 at serine 845 and serine 831 as well as the phosphorylation of GluR2 at serine 880 had no significant difference between low-frequency stimuli slices and control slices.

Similar articles

Cited by

References

    1. Allen PB, Zachariou V, Svenningsson P, Lepore AC, Centonze D, Costa C, Rossi S, Bender G, Chen G, Feng J, Snyder GL, Bernardi G, Nestler EJ, Yan Z, Calabresi P, Greengard P. Distinct roles for spinophilin and neurabin in dopamine-mediated plasticity. Neuroscience. 2006;140:897–911. - PubMed
    1. Boehm J, Kang MG, Johnson RC, Esteban J, Huganir RL, Malinow R. Synaptic incorporation of AMPA receptors during LTP is controlled by a PKC phosphorylation site on GluR1. Neuron. 2006;51:213–225. - PubMed
    1. Bornancin F, Parker PJ. Phosphorylation of protein kinase C-alpha on serine 657 controls the accumulation of active enzyme and contributes to its phosphatase-resistant state. J Biol Chem. 1997;272:3544–3549. - PubMed
    1. Bredt DS, Nicoll RA. AMPA receptor trafficking at excitatory synapses. Neuron. 2003;40:361–379. - PubMed
    1. Carroll RC, Nicoll RA, Malenka RC. Effects of PKA and PKC on miniature excitatory postsynaptic currents in CA1 pyramidal cells. J Neurophysiol. 1998;80:2797–2800. - PubMed

Publication types

MeSH terms

LinkOut - more resources