. 2007 Apr 25;27(17):4707-15.
doi: 10.1523/JNEUROSCI.0758-07.2007.

BK channels with beta3a subunits generate use-dependent slow afterhyperpolarizing currents by an inactivation-coupled mechanism

Affiliations

BK channels with beta3a subunits generate use-dependent slow afterhyperpolarizing currents by an inactivation-coupled mechanism

Xu-Hui Zeng et al. J Neurosci. .

Abstract

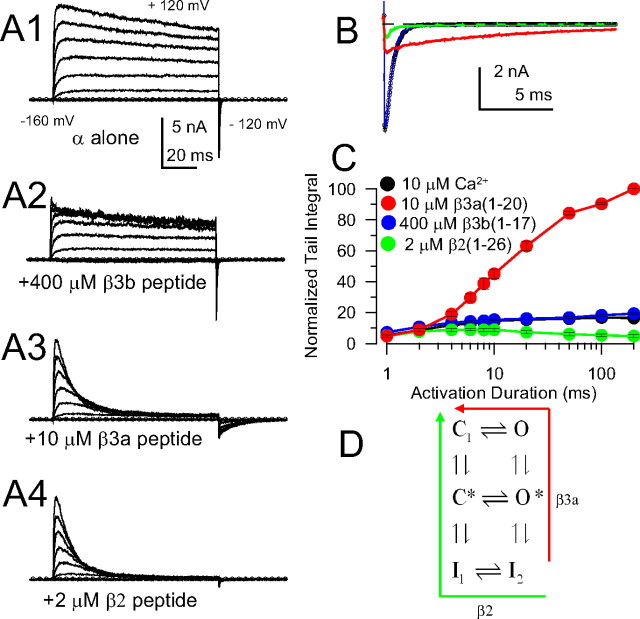
Large-conductance, Ca2+- and voltage-activated K+ (BK) channels are broadly expressed proteins that respond to both cellular depolarization and elevations in cytosolic Ca2+. The characteristic functional properties of BK channels among different cells are determined, in part, by tissue-specific expression of auxiliary beta subunits. One important functional property conferred on BK channels by beta subunits is inactivation. Yet, the physiological role of BK channel inactivation remains poorly understood. Here we report that as a consequence of a specific mechanism of inactivation, BK channels containing the beta3a auxiliary subunit exhibit an anomalous slowing of channel closing. This produces a net repolarizing current flux that markedly exceeds that expected if all open channels had simply closed. Because of the time dependence of inactivation, this behavior results in a Ca2+-independent but time-dependent increase in a slow tail current, providing an unexpected mechanism by which use-dependent changes in slow afterhyperpolarizations might regulate electrical firing. The physiological significance of inactivation in BK channels mediated by different beta subunits may therefore arise not from inactivation itself, but from the differences in the amplitude and duration of repolarizing currents arising from the beta-subunit-specific energetics of recovery from inactivation.


Figures

Figure 1.
Figure 1.
The N terminus of the β3a subunit mediates an inactivation-dependent slowing and enhancement of BK channel after repolarization. A, BK β subunits contain two transmembrane domains joined by an extracellular loop containing sets of conserved cysteine residues (orange residues). The cytosolic N termini (N-term) of some β subunits mediate inactivation, whereas no function has been ascribed to the C terminus (C-term). The diagram shows the D20 construct, which represents a β2 subunit in which the N terminus is replaced by the β3a N terminus. Red residues on the cytosolic N terminus correspond to basic residues in the β3a N terminus. B, The indicated voltage protocol was used to activate currents resulting either from α subunits alone, α + β3a subunits, or α + β3b subunits. Traces reveal the marked differences in inactivation and deactivation behavior for each type of channel. 10 μm Ca2+. C, Traces show the normalized tail current time course at −120 mV after depolarization to +200 mV for α alone, α + β3b, and α + β3a. D, Human β3a sequence contains an additional 20 N-terminal residues compared with β3b.
Figure 2.
Figure 2.
Removal of inactivation by cytosolic application of trypsin also abolishes slow tail current. A, Removal of α + β3a inactivation by cytosolic trypsin (0.1 mg/ml) abolishes tail current enhancement; 0 Ca2+. B, For the same patch as in A, currents activated by 10 μm Ca2+ are shown before and after removal of inactivation by trypsin. C, Expanded time base displays of tail currents at −120 mV from A and B show that removal of inactivation by trypsin speeds up deactivation time course and reduces net tail current flux. D, For the tail currents in C, the integral of net current through each tail currents was determined over a 100 ms time period. The net tail current flux with an intact β3a inactivation domain greatly exceeds that after removal of the inactivation mechanism.
Figure 3.
Figure 3.
Inactivation of α + β3a currents is coupled to the use-dependent increase in net tail current flux. A, α + β3a currents were activated by the indicated protocol with 10 μm cytosolic Ca2+ to allow examination of the tail current properties as a function of the duration of the preceding depolarizing voltage step. Shorter-duration depolarizing steps are associated with faster-deactivating tail currents. B, The tail current decay time course (black lines) after repolarization to −150 mV was fit with a two-component exponential function (red lines) yielding a fast (τf) and slow (τs) time constant of deactivation. τf and τs were, after the 1 ms step, 0.27 ± 0.001 and 29.05 ± 0.02 ms; after the 6 ms step, 0.36 ± 0.002 and 30.23 ± 0.01 ms; and after the 50 ms step, 0.64 ± 0.01 and 32.4 ± 0.04 ms. C, The time course of current inactivation (blue line) during a step to +180 mV is compared with the fractional increase in the slow component of tail current (red circles) after command steps to +180 mV of differing durations. The fitted inactivation time constant (black line) was 26.1 ± 0.2 ms. For a set of patches, the percentage of the slow component in the tail current increased as a function of command-step duration with a time constant of 33.5 ± 2.9 ms. D, The time constants for τf and τs exhibit little change with command-step duration. Solid black symbol at 50 ms step duration corresponds to single exponential deactivation time after removal of inactivation by trypsin. E, Changes in α + β3a tail current properties before and after removal of inactivation by trypsin are shown for 0 Ca2+. The command step was to +180 mV with the tail current at −150 mV. F, Tail current integrals after command steps of different durations from traces as in E were determined. In each case, net flux was normalized to that observed after a 200 ms activation step with 10 μm Ca2+ after removal of inactivation by trypsin. An intact β3a N terminus results in inactivation-dependent increases in net tail current flux compared with channels in which the inactivation domain is removed by trypsin.
Figure 4.
Figure 4.
Brief, high-frequency depolarizations elicit development of the α + β3a-mediated slow component of BK tail current. An inside-out patch was stimulated with a high-frequency train of 20 3 ms depolarizations to +80 mV (left protocol shown on top) with the protocol for each cycle of depolarization shown on the right. A, The repetitive stimulation protocol results in use-dependent increase in slow α + β3a tail current. An inside-out patch was stimulated repetitively, as shown, while bathed with 10 μm Ca2+. Traces show a use-dependent decrease in outward current, but an increase in inward tail current at the end of each hyperpolarization to −90 mV. Traces show 1st, 2nd, 5th, and 15th of 20. B, Brief trypsin application (0.5 mg/ml) removes the use-dependent changes in BK current. C, Changes in peak outward current are plotted as a function of stimulus number for the experiments in A and B, showing a use-dependent reduction in outward current that is removed by trypsin. D, Changes in amplitude of the tail current measured at 5 ms are plotted as a function of stimulus number from the experiments in A and B showing the use-dependent enhancement of persistent tail current, which is abolished by trypsin.
Figure 5.
Figure 5.
Two-step inactivation provides a mechanism that can generate use-dependent enhancement of net tail current flux. A, Currents were simulated for a simple block model (C1 ⇌ C2 ⇌ OI) with the indicated voltage protocol. Rates are given in the Materials and Methods. The longer depolarization produces current inactivation, whereas repolarization exhibits unblocking behavior characteristic of passage back through the open state. B, Tail currents from the simulation in A are shown at higher time resolution (top). On the bottom, the tail current integral was determined for both traces on the top and normalized to the maximum value associated with the brief depolarization. The small excess of net tail current flux after the prolonged depolarization reflects the fact that the brief depolarization was too short to produce maximal channel activation. C, Using the indicated stimulation protocol, currents were simulated with a two-step inactivation model (C1 ⇌ C2 ⇌ OO* ⇌ I) with rates given in the Materials and Methods. D, Tail currents from the simulation in C shown at a faster time base (top) emphasize the marked prolongation of tail current decay, whereas the tail current integrals (normalized to values in B) show the marked enhancement of net tail current flux associated with recovery via a two-step inactivation pathway.
Figure 6.
Figure 6.
The β3a inactivation particle produces prolonged low-conductance bursts. A 10 ms depolarization with 10 μm Ca2+ was used to activate openings of a single BK (α + D20A) channel, and all traces in A and B are from the same patch. A, Three examples in which the channel was open at the end of the 10 ms step are shown, and, on the bottom, the ensemble average (blue trace) plotted in units of open probability (Po) is displayed for all such sweeps in this patch. The averaged tail current decayed with a τd of 0.47 ms. B, Sweeps are shown in which the channel inactivates either before or during the 10 ms step resulting in a prolonged, low-amplitude tail current opening. The diamonds indicate larger-conductance openings that often terminate the prolonged bursts. On the bottom (red trace), the ensemble average for traces in which the channel was inactivated before repolarization is shown. The tail current decayed with a time constant of 41.1 ms. C, Traces show the averages for all sweeps (black), sweeps with no inactivation (blue), and those sweeps with inactivation (red). For the brief 10 ms depolarization, the ensemble tail current of all openings contains both fast and slow deactivating components, whereas the tail current for channels that were inactivated before depolarization shows only slow deactivation.
Figure 7.
Figure 7.
A β3a N-terminal peptide produces block and tail current openings characteristic of the tethered native N terminus. A, A single BK channel (α subunits alone) was activated by a depolarizing step to +150 mV (as indicated) with 10 μm Ca2+. Channel opening persists for the duration of the command step, but after repolarization to −120 mV, the channel rapidly closes. B, Application of 10 μm β3a(1–20) peptide produces rapid and strong block during the depolarizing step. After repolarization, the channel immediately returns to a prolonged open level of reduced amplitude, with the tail opening terminated by a brief opening to a full conductance level (arrows).
Figure 8.
Figure 8.
Distinct β subunit inactivation domains differentially regulate BK channel deactivation properties. A1, The top traces show currents resulting from BK α subunits alone. Currents were activated by voltage steps from −140 mV to +120 mV (20 mV increments) with tail currents at −120 mV. For the three panels below, specific β subunit N-terminal peptides were sequentially applied and washed out from this same patch. A2, 400 μm β3b(1–17) peptide resulted in rapid, incomplete block of BK current, with rapid unblock during the tail currents, an effect similar to the intact β3b subunit (Fig. 1B) (Xia et al., 2000). A3, 10 μm β3a(1–20) peptide was applied to the same patch, resulting in slower block, and then a prolonged tail current, characteristic of the intact β3a subunit. A4, 2 μm β2(1–26) peptide was then applied, producing a more complete inactivation of BK current, with little tail current, similar to effects of the intact β2 subunit (Xia et al., 1999). B, Tail currents after the depolarization to +120 mV are shown for control (black circles), β3b peptide (blue line), β2 peptide (green line), and β3a peptide (red line), all from the same patch. C, The integral of current flux during the tail current is plotted as a function of command-step duration for control and peptide conditions. Net current flux in the presence of β3b peptide varies with command-step duration in a manner similar to control currents, indicative that β3b blocked channels rapidly return to a fully open state. For the β2 peptide, net tail current flux is reduced as block develops. For β3a peptide, net tail current flux increases markedly over that expected for all open BK channels simply passing back through a single open state. D, Differences in the effects of β2 and β3a N termini on BK tail currents may arise from different pathways of recovery from inactivation. Arrows highlight possible preferred recovery paths for the two different N termini.

Similar articles

Cited by

References

    1. Benzinger GR, Xia XM, Lingle CJ. Direct observation of a preinactivated, open state in BK channels with β2 subunits. J Gen Physiol. 2006;127:119–131. - PMC - PubMed
    1. Cox D, Aldrich R. Role of the β1 subunit in large-conductance Ca2+-activated K+ channel gating energetics. Mechanisms of enhanced Ca2+ sensitivity. J Gen Physiol. 2000;116:411–432. - PMC - PubMed
    1. Demo SD, Yellen G. The inactivation gate of the Shaker K+ channel behaves like an open-channel blocker. Neuron. 1991;7:743–753. - PubMed
    1. Faber ES, Sah P. Physiological role of calcium-activated potassium currents in the rat lateral amygdala. J Neurosci. 2002;22:1618–1628. - PMC - PubMed
    1. Faraldo-Gomez JD, Kutluay E, Jogini V, Zhao Y, Heginbotham L, Roux B. Mechanism of intracellular block of the KcsA K+ channel by tetrabutylammonium: insights from X-ray crystallography, electrophysiology and replica-exchange molecular dynamics simulations. J Mol Biol. 2007;365:649–662. - PubMed

Publication types

MeSH terms

LinkOut - more resources