

Modulation of CD4(+) T cell-dependent specific cytotoxic CD8(+) T cells differentiation and proliferation by the timing of increase in the pathogen load
- PMID: 17460760
- PMCID: PMC1849967
- DOI: 10.1371/journal.pone.0000393
Modulation of CD4(+) T cell-dependent specific cytotoxic CD8(+) T cells differentiation and proliferation by the timing of increase in the pathogen load
Abstract
Background: Following infection with viruses, bacteria or protozoan parasites, naïve antigen-specific CD8(+) T cells undergo a process of differentiation and proliferation to generate effector cells. Recent evidences suggest that the timing of generation of specific effector CD8(+) T cells varies widely according to different pathogens. We hypothesized that the timing of increase in the pathogen load could be a critical parameter governing this process.
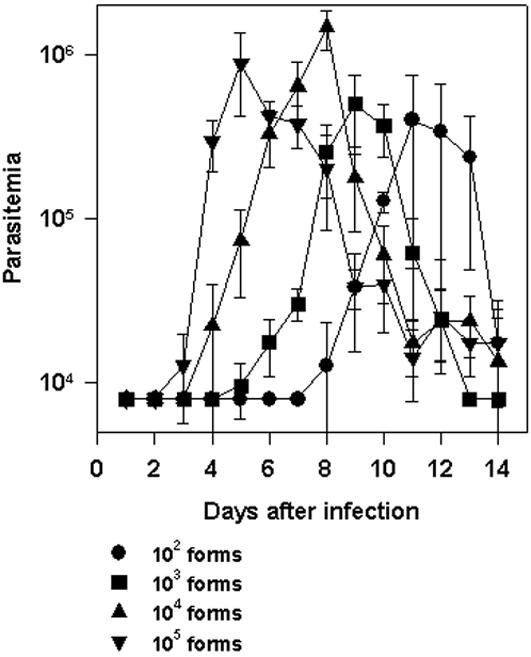
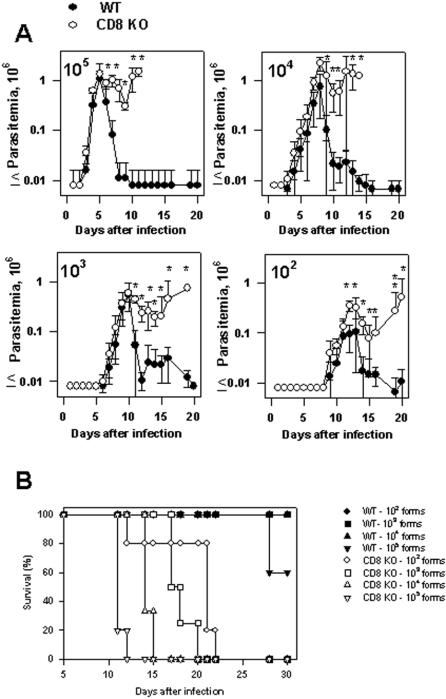
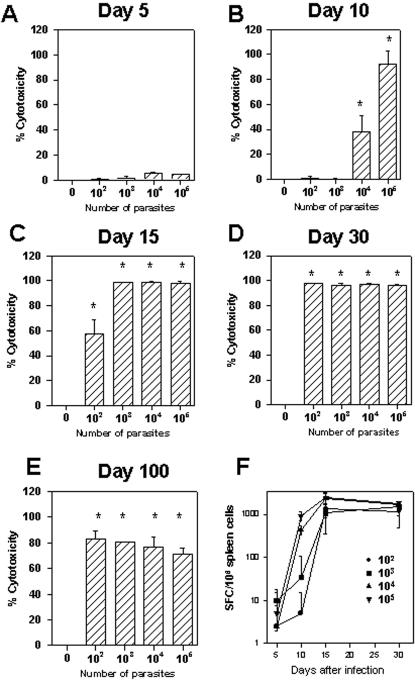
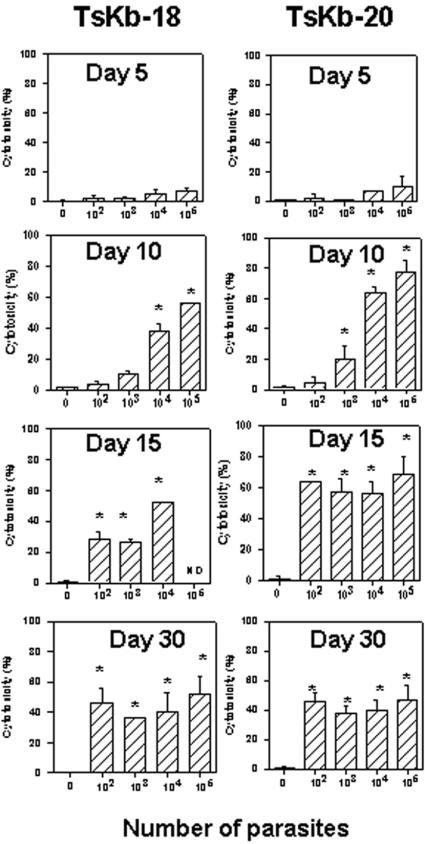
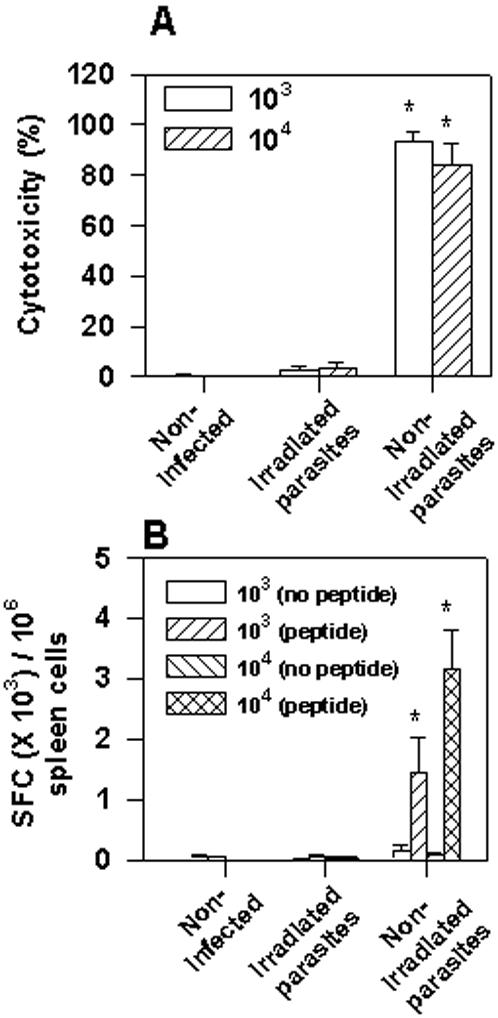
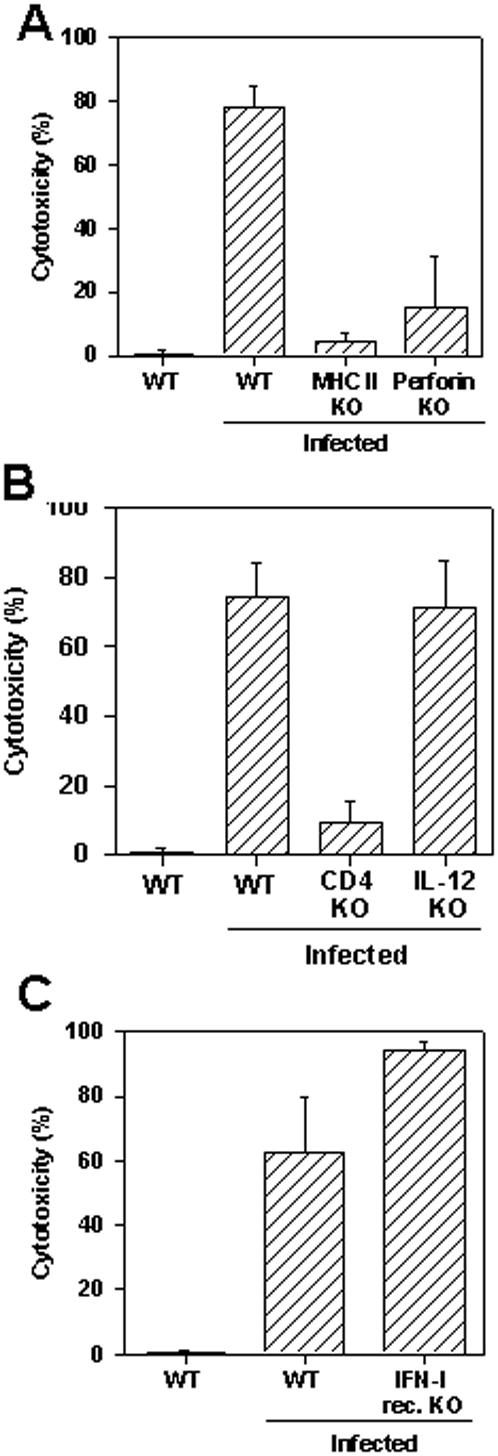
Methodology/principal findings: Using increasing doses of the protozoan parasite Trypanosoma cruzi to infect C57BL/6 mice, we observed a significant acceleration in the timing of parasitemia without an increase in mouse susceptibility. In contrast, in CD8 deficient mice, we observed an inverse relationship between the parasite inoculum and the timing of death. These results suggest that in normal mice CD8(+) T cells became protective earlier, following the accelerated development of parasitemia. The evaluation of specific cytotoxic responses in vivo to three distinct epitopes revealed that increasing the parasite inoculum hastened the expansion of specific CD8(+) cytotoxic T cells following infection. The differentiation and expansion of T. cruzi-specific CD8(+) cytotoxic T cells is in fact dependent on parasite multiplication, as radiation-attenuated parasites were unable to activate these cells. We also observed that, in contrast to most pathogens, the activation process of T. cruzi-specific CD8(+) cytotoxic T cells was dependent on MHC class II restricted CD4(+) T cells.
Conclusions/significance: Our results are compatible with our initial hypothesis that the timing of increase in the pathogen load can be a critical parameter governing the kinetics of CD4(+) T cell-dependent expansion of pathogen-specific CD8(+) cytotoxic T cells.
Conflict of interest statement
Figures
Similar articles
-
Limited role for CD4+ T-cell help in the initial priming of Trypanosoma cruzi-specific CD8+ T cells.Infect Immun. 2007 Jan;75(1):231-5. doi: 10.1128/IAI.01245-06. Epub 2006 Oct 16. Infect Immun. 2007. PMID: 17043105 Free PMC article.
-
IL-10 participates in the expansion and functional activation of CD8+ T cells during acute infection with Trypanosoma cruzi.J Leukoc Biol. 2019 Jan;105(1):163-175. doi: 10.1002/JLB.3A0318-111RR. Epub 2018 Oct 29. J Leukoc Biol. 2019. PMID: 30371945
-
Paraflagellar rod protein-specific CD8+ cytotoxic T lymphocytes target Trypanosoma cruzi-infected host cells.Parasite Immunol. 2002 Aug;24(8):401-12. doi: 10.1046/j.1365-3024.2002.00479.x. Parasite Immunol. 2002. PMID: 12406194
-
IL-1β strikingly enhances antigen-driven CD4 and CD8 T-cell responses.Cold Spring Harb Symp Quant Biol. 2013;78:117-24. doi: 10.1101/sqb.2013.78.021246. Epub 2013 Oct 3. Cold Spring Harb Symp Quant Biol. 2013. PMID: 24092469 Review.
-
Generation, specificity, and function of CD8+ T cells in Trypanosoma cruzi infection.Immunol Rev. 2004 Oct;201:304-17. doi: 10.1111/j.0105-2896.2004.00183.x. Immunol Rev. 2004. PMID: 15361249 Review.
Cited by
-
Perforin-expressing cytotoxic cells contribute to chronic cardiomyopathy in Trypanosoma cruzi infection.Int J Exp Pathol. 2010 Feb;91(1):72-86. doi: 10.1111/j.1365-2613.2009.00670.x. Epub 2009 Oct 28. Int J Exp Pathol. 2010. PMID: 19878357 Free PMC article.
-
CD8+ T-cells expressing interferon gamma or perforin play antagonistic roles in heart injury in experimental Trypanosoma cruzi-elicited cardiomyopathy.PLoS Pathog. 2012;8(4):e1002645. doi: 10.1371/journal.ppat.1002645. Epub 2012 Apr 19. PLoS Pathog. 2012. PMID: 22532799 Free PMC article.
-
Different parasite inocula determine the modulation of the immune response and outcome of experimental Trypanosoma cruzi infection.Immunology. 2013 Feb;138(2):145-56. doi: 10.1111/imm.12022. Immunology. 2013. PMID: 23113506 Free PMC article.
-
Host-parasite dynamics in Chagas disease from systemic to hyper-local scales.Parasite Immunol. 2021 Feb;43(2):e12786. doi: 10.1111/pim.12786. Epub 2020 Sep 24. Parasite Immunol. 2021. PMID: 32799361 Free PMC article. Review.
-
Circulating MicroRNAs and myocardial involvement severity in chronic Chagas cardiomyopathy.Front Cell Infect Microbiol. 2022 Aug 8;12:922189. doi: 10.3389/fcimb.2022.922189. eCollection 2022. Front Cell Infect Microbiol. 2022. PMID: 36004323 Free PMC article.
References
-
- Harty JT, Badovinac VP. Influence of effector molecules on the CD8+ T cell response to infection. Curr Opin Immunol. 2002;14:360–365. - PubMed
-
- Tsuji M, Zavala F. T cells as mediators of protective immunity against liver stages of Plasmodium. Trends Parasitol. 2003;19:88–93. - PubMed
-
- Murali-Krishna K, Altman JD, Suresh M, Sourdive DJ, Zajac AJ, et al. Counting antigen-specific CD8 T cells: a reevaluation of bystander activation during viral infection. Immunity. 1998;8:177–187. - PubMed
Publication types
MeSH terms
LinkOut - more resources
Full Text Sources
Other Literature Sources
Molecular Biology Databases
Research Materials
