

Global gene expression analysis and regulation of the principal genes expressed in bovine placenta in relation to the transcription factor AP-2 family
- PMID: 17462098
- PMCID: PMC1867817
- DOI: 10.1186/1477-7827-5-17
Global gene expression analysis and regulation of the principal genes expressed in bovine placenta in relation to the transcription factor AP-2 family
Abstract
Background: Cell-cell communication is an important factor in feto-maternal units during placentogenesis. The placenta produces pivotal hormones and cytokines for communication between cotyledonary villi and the maternal caruncle. Gene expression in bovine placenta throughout pregnancy was comprehensively screened by a cDNA microarray, and we searched for a common transcription factor in a gene cluster that showed increasing expression throughout gestation in cotyledonary villi and caruncle.
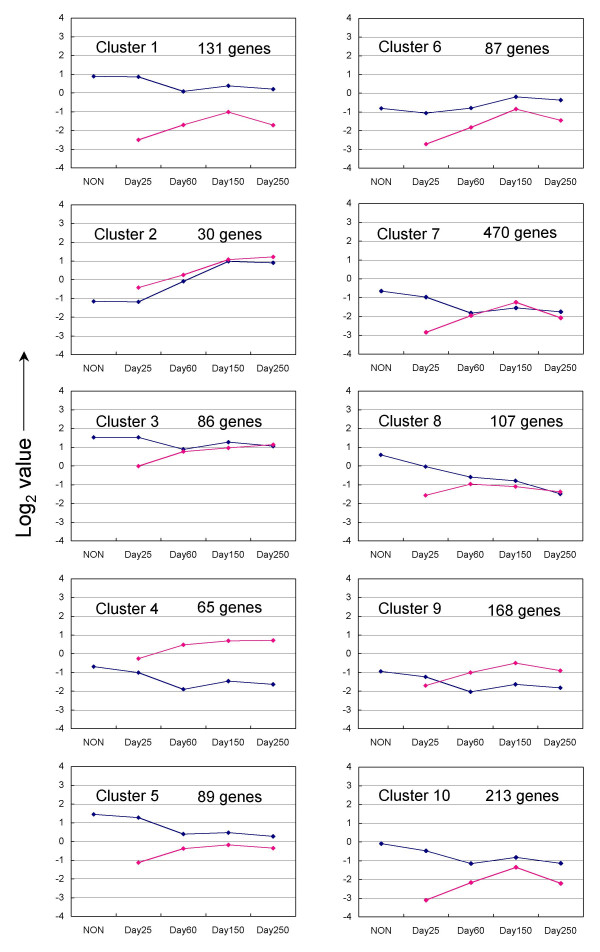
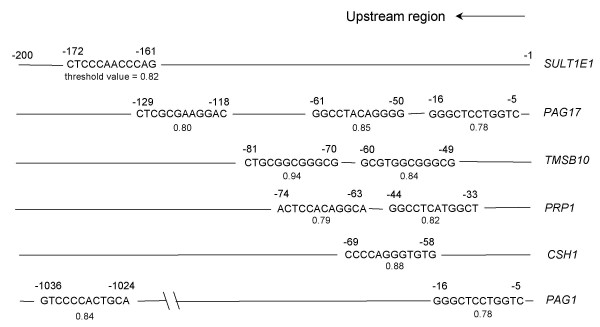
Methods: Placentomal tissues (villi and caruncle) were collected from Day 25 to Day 250 of gestation for microarray analysis. Global gene expression profiles were analyzed using the k-means clustering method. A consensus sequence cis-element that may control up-regulated genes in a characteristic cluster was examined in silico. The quantitative expression and localization of a specific transcription factor were investigated in each tissue using quantitative real-time RT-PCR and in situ hybridization.
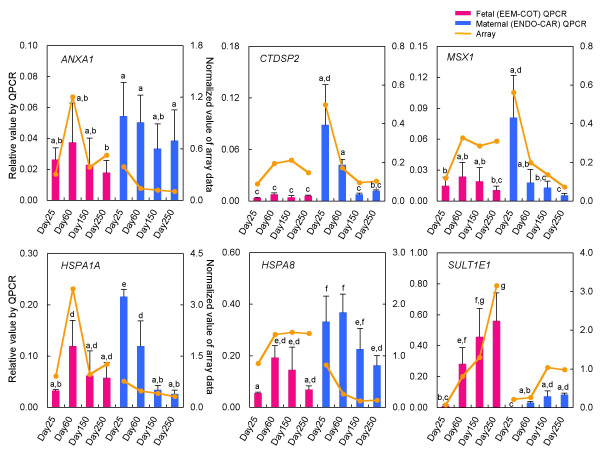
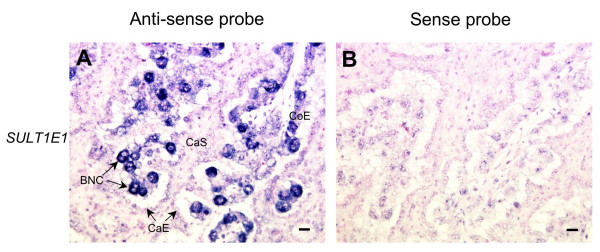
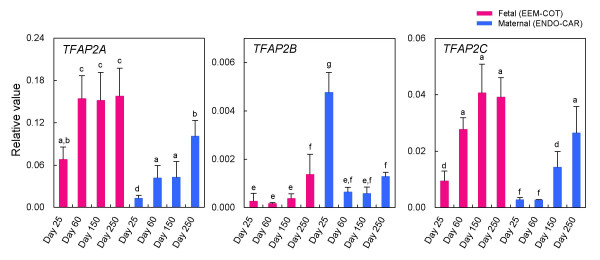
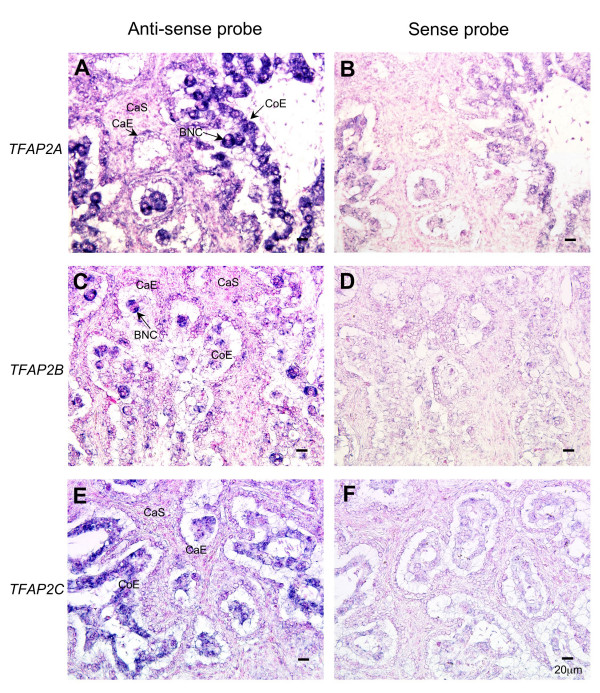
Results: The microarray expression profiles were classified into ten clusters. The genes with most markedly increased expression became concentrated in cluster 2 as gestation proceeded. Cluster 2 included placental lactogen (CSH1), pregnancy-associated glycoprotein-1 (PAG1), and sulfotransferase family 1E estrogen-preferring member 1 (SULT1E1), which were mainly detected in giant trophoblast binucleate cells (BNC). Consensus sequence analysis identified transcription factor AP-2 binding sites in some genes in this cluster. Quantitative real-time RT-PCR analysis confirmed that high level expression of transcription factor AP-2 alpha (TFAP2A) was common to cluster 2 genes during gestation. In contrast, the expression level of another AP-2 family gene, transcription factor AP-2 beta (TFAP2B), was extremely low over the same period. Another gene of the family, transcription factor AP-2 gamma (TFAP2C), was expressed at medium level compared with TFAP2A and TFAP2B. In situ hybridization showed that TFAP2A, TFAP2B and TFAP2C mRNAs were localized in trophoblast cells but were expressed by different cells. TFAP2A was expressed in cotyledonary epithelial cells including BNC, TFAP2B was specifically expressed in BNC, and TFAP2C in mononucleate cells.
Conclusion: We detected gestational-stage-specific gene expression profiles in bovine placentomes using a combination of microarray and in silico analysis. In silico analysis indicated that the AP-2 family may be a consensus regulator for the gene cluster that characteristically appears in bovine placenta as gestation progresses. In particular, TFAP2A and TFAP2B may be involved in regulating binucleate cell-specific genes such as CSH1, some PAG or SULT1E1. These results suggest that the AP-2 family is a specific transcription factor for clusters of crucial placental genes. This is the first evidence that TFAP2A may regulate the differentiation and specific functions of BNC in bovine placenta.
Figures
Similar articles
-
Delivery of AP-2α siRNA into cultured bovine trophoblast cells by electroporation repressed key placenta-specific gene expression.Gene. 2012 May 10;499(1):169-75. doi: 10.1016/j.gene.2012.03.005. Epub 2012 Mar 9. Gene. 2012. PMID: 22425968
-
Temporospatial expression of placental lactogen and prolactin-related protein-1 genes in the bovine placenta and uterus during pregnancy.Mol Reprod Dev. 2004 Oct;69(2):146-52. doi: 10.1002/mrd.20119. Mol Reprod Dev. 2004. PMID: 15293215
-
Small scale transcript expression profile of Human first trimester placental villi analyzed by a custom-tailored cDNA array.Indian J Physiol Pharmacol. 2010 Jul-Sep;54(3):235-54. Indian J Physiol Pharmacol. 2010. PMID: 21409862
-
The evolution, regulation, and function of placenta-specific genes.Annu Rev Cell Dev Biol. 2008;24:159-81. doi: 10.1146/annurev.cellbio.24.110707.175418. Annu Rev Cell Dev Biol. 2008. PMID: 18616428 Review.
-
Analysis of uteroplacental-specific molecules and their functions during implantation and placentation in the bovine.J Reprod Dev. 2007 Feb;53(1):1-11. doi: 10.1262/jrd.18123. J Reprod Dev. 2007. PMID: 17332695 Review.
Cited by
-
Novel SNPs and InDels discovered in two promoter regions of porcine pregnancy-associated glycoprotein 2-like subfamily (pPAG2-Ls) in crossbreed pigs.Funct Integr Genomics. 2016 Nov;16(6):705-715. doi: 10.1007/s10142-016-0522-z. Epub 2016 Oct 5. Funct Integr Genomics. 2016. PMID: 27709373 Free PMC article.
-
Evaluation of real-time PCR endogenous control genes for analysis of gene expression in bovine endometrium.BMC Mol Biol. 2009 Nov 1;10:100. doi: 10.1186/1471-2199-10-100. BMC Mol Biol. 2009. PMID: 19878604 Free PMC article.
-
Sericin accelerates the production of hyaluronan and decreases the incidence of polyspermy fertilization in bovine oocytes during in vitro maturation.J Reprod Dev. 2014;60(4):268-73. doi: 10.1262/jrd.2013-110. Epub 2014 Apr 21. J Reprod Dev. 2014. PMID: 24748396 Free PMC article.
-
TFAP2C is a key regulator of intrauterine trophoblast cell invasion and deep hemochorial placentation.JCI Insight. 2024 Dec 3;10(2):e186471. doi: 10.1172/jci.insight.186471. JCI Insight. 2024. PMID: 39625795 Free PMC article.
-
Differential gene expression of serine protease inhibitors in bovine ovarian follicle: possible involvement in follicular growth and atresia.Reprod Biol Endocrinol. 2011 May 27;9:72. doi: 10.1186/1477-7827-9-72. Reprod Biol Endocrinol. 2011. PMID: 21619581 Free PMC article.
References
-
- Wooding FBP, Flint AP. Placentation. In: Lamming GE, editor. Marshall's Physiology of Reproduction. 4. Vol. 4. London, Chapman & Hall; 1994. pp. 233–460.
-
- Ishiwata H, Katsuma S, Kizaki K, Patel OV, Nakano H, Takahashi T, Imai K, Hirasawa A, Shiojima S, Ikawa H, Suzuki Y, Tsujimoto G, Izaike Y, Todoroki J, Hashizume K. Characterization of gene expression profiles in early bovine pregnancy using a custom cDNA microarray. Mol Reprod Dev. 2003;65:9–18. doi: 10.1002/mrd.10292. - DOI - PubMed
-
- Ushizawa K, Herath CB, Kaneyama K, Shiojima S, Hirasawa A, Takahashi T, Imai K, Ochiai K, Tokunaga T, Tsunoda Y, Tsujimoto G, Hashizume K. cDNA microarray analysis of bovine embryo gene expression profiles during the pre-implantation period. Reprod Biol Endocrinol. 2004;2:77. doi: 10.1186/1477-7827-2-77. - DOI - PMC - PubMed
Publication types
MeSH terms
Substances
LinkOut - more resources
Full Text Sources
Molecular Biology Databases
Research Materials
