Clinical Trial
. 2007 Sep 1;110(5):1603-6.
doi: 10.1182/blood-2007-01-066258. Epub 2007 Apr 26.

Deficient CD4+ CD25+ FOXP3+ T regulatory cells in acquired aplastic anemia

Affiliations
Clinical Trial

Deficient CD4+ CD25+ FOXP3+ T regulatory cells in acquired aplastic anemia

Elena E Solomou et al. Blood. .

Abstract

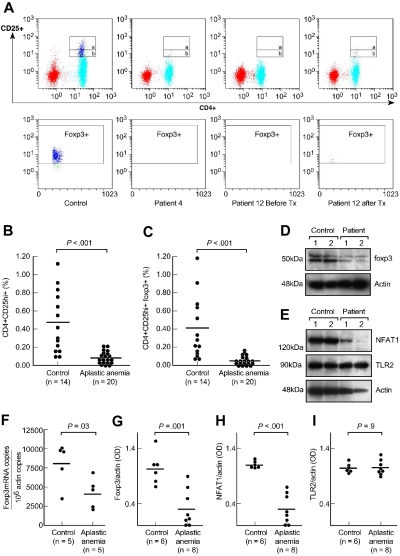
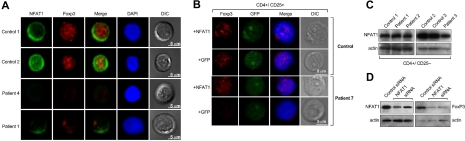
Regulatory T cells are believed to control the development and progression of autoimmunity by suppressing autoreactive T cells. Decreased numbers of CD4(+)CD25(+) FOXP3(+) T cells (Tregs) are associated with impaired immune homeostasis and development of autoimmune diseases. The transcription factors FOXP3 and NFAT1 have key roles in regulatory T-cell development and function. We show that Tregs are decreased at presentation in almost all patients with aplastic anemia; FOXP3 protein and mRNA levels also are significantly lower in patients with aplastic anemia and NFAT1 protein levels are decreased or absent. Transfection of FOXP3-deficient CD4(+)CD25(+) T cells from patients with a plasmid encoding wild-type NFAT1 resulted in increased FOXP3 expression in these cells. By NFAT1 knockdown in CD4(+)CD25(+) T cells, FOXP3 expression was decreased when NFAT1 expression was decreased. Our findings indicate that decreased NFAT1 could explain low FOXP3 expression and diminished Treg frequency in aplastic anemia. Treg defects are now implicated in autoimmune marrow failure.


Figures

Figure 1
Figure 1
CD4+CD25+ T cells in patients with aplastic anemia and in healthy control subjects. (A) Peripheral blood mononuclear cells from patients with aplastic anemia and healthy control subjects were stained with anti-CD4 and anti-CD25 antibodies followed by intracellular anti-FOXP3 antibodies. The upper gate on the dot plots (gate a) represents CD4+CD25hi+ T cells and the lower gate (gate b) the CD4+CD25+ T cells. FOXP3 expression was gated on CD4+CD25hi+ T cell population (gate a). Representative dot plots are shown from a healthy control subject, a patient with aplastic anemia, and another patient before and after immunosuppressive treatment. Tx, treatment. (B,C) Relative numbers of CD4+CD25hi+ T and CD4+CD25hi+ FOXP3+ T cells from all healthy control subjects and patients with aplastic anemia examined are shown. All patients were examined before receiving any immunosuppressive treatment. Differences between patients and control subjects were statistically significant (P < .001). (D) CD4+CD25+ T cells' nuclear extracts from healthy volunteers and patients with aplastic anemia were analyzed for FOXP3 expression. All patients examined had significantly decreased FOXP3 protein levels compared with healthy donors (P < .001). All patients' samples were analyzed side-by-side with healthy donors' samples. (E) Cytoplasmic extracts from CD4+CD25+ T cells from patients and healthy donors were analyzed by immunoblot for NFAT1 expression. All patients examined showed diminished or undetectable NFAT1 protein levels compared with healthy control subjects (P < .001). All patients' samples were run side-by-side with control subjects' samples. There were no differences in TLR2 expression between patients and control subjects. (F) RNA from CD4+CD25+ T cells from patients with aplastic anemia and control subjects was analyzed for FOXP3 gene expression in quantitative polymerase chain reaction experiments. Patients with aplastic anemia showed decreased FOXP3 mRNA/actin copies compared with healthy control subjects (P = .03). Horizontal lines represent mean values. (G-I) The densitometric intensities of immunoblot results from all the subjects studied for FOXP3, NFAT1, and TLR2 expression are collectively presented. Horizontal lines represent mean values. Results are plus or minus standard error of the mean (± SEM).
Figure 2
Figure 2
FOXP3 and NFAT1 in primary CD4+CD25+ T cells. (A) Purified CD4+CD25+ T cells from patients and healthy donors were analyzed by confocal microscopy for NFAT1 and FOXP3 expression. NFAT1 resided in the cytoplasm in unstimulated cells from control subject and FOXP3 was localized in the nucleus. All patients with aplastic anemia who were examined showed decreased or absent NFAT1 and FOXP3. Representative results are shown from at least 4 different experiments. In all experiments, patients' and control subjects' cells were stained in parallel. DIC indicates differential interference contrast; DAPI, 4′-6-diamidino-2-phenylindole. (B) Purified CD4+CD25+ T cells from patients and healthy donors were analyzed by confocal microscopy for FOXP3 expression after transient transfection with a wild-type NFAT1 construct. CD4+CD25+ T cells from healthy donors did not show any difference in FOXP3 expression after transfection with the NFAT1 construct. CD4+CD25+ T cells from patients showed significantly increased FOXP3 expression after the transfection. Representative results are shown from at least 4 different experiments. Patients' and control subjects' cells were transfected and stained in parallel. (C) NFAT1 levels in CD4+CD25 T cells were comparable between patients and control subjects. (D) Cytoplasmic and nuclear extracts from CD4+CD25+ T cells (from healthy donors, n = 2) transfected with NFAT1-siRNA were analyzed by immunoblot for NFAT1 and FOXP3 expression, respectively. The NFAT1-knockdown CD4+CD25+ T cells showed decreased FOXP3 expression compared with the cells that were transfected with a control small inhibitory RNA. See “Patients, materials and methods, Confocal microscopy and T-cell transfections” for detailed image acquisition information.

References

    1. Beissert S, Schwarz A, Schwarz T. Regulatory T cells. J Invest Dermatol. 2006;126:15–24. - PubMed
    1. Beyer M, Schultze JL. Regulatory T cells in cancer. Blood. 2006;108:804–811. - PubMed
    1. Sakaguchi S. Naturally arising Foxp3-expressing CD25+CD4+ regulatory T cells in immunological tolerance to self and non-self. Nat Immunol. 2005;6:345–352. - PubMed
    1. Shevach EM, DiPaolo RA, Andersson J, et al. The lifestyle of naturally occurring CD4+ CD25+ Foxp3+ regulatory T cells. Immunol Rev. 2006;212:60–73. - PubMed
    1. Gambineri E, Torgerson TR, Ochs HD. Immune dysregulation, polyendocrinopathy, enteropathy, and X-linked inheritance (IPEX), a syndrome of systemic autoimmunity caused by mutations of FOXP3, a critical regulator of T-cell homeostasis. Curr Opin Rheumatol. 2003;15:430–435. - PubMed

Publication types

MeSH terms

Substances