

Replication of genome-wide association signals in UK samples reveals risk loci for type 2 diabetes
- PMID: 17463249
- PMCID: PMC3772310
- DOI: 10.1126/science.1142364
Replication of genome-wide association signals in UK samples reveals risk loci for type 2 diabetes
Erratum in
- Science. 2007 Aug 24;317(5841):1035-6
Abstract
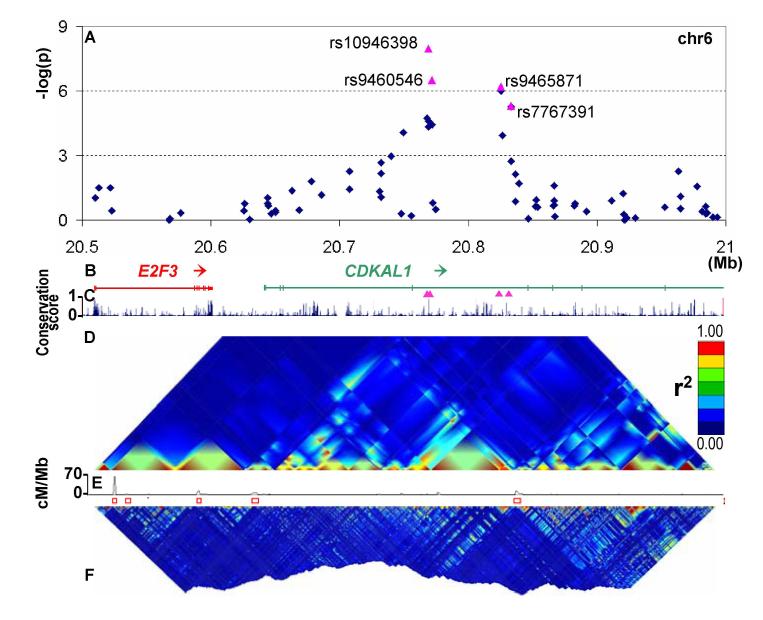
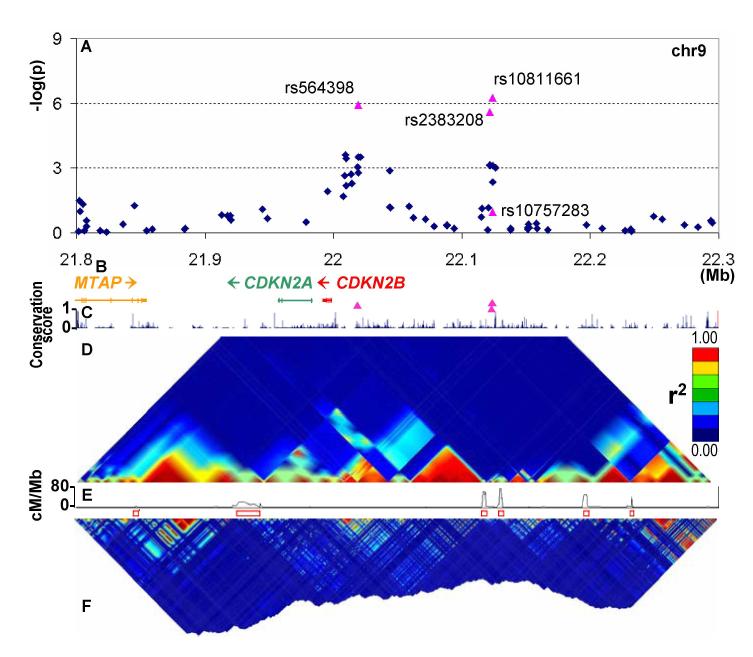
The molecular mechanisms involved in the development of type 2 diabetes are poorly understood. Starting from genome-wide genotype data for 1924 diabetic cases and 2938 population controls generated by the Wellcome Trust Case Control Consortium, we set out to detect replicated diabetes association signals through analysis of 3757 additional cases and 5346 controls and by integration of our findings with equivalent data from other international consortia. We detected diabetes susceptibility loci in and around the genes CDKAL1, CDKN2A/CDKN2B, and IGF2BP2 and confirmed the recently described associations at HHEX/IDE and SLC30A8. Our findings provide insight into the genetic architecture of type 2 diabetes, emphasizing the contribution of multiple variants of modest effect. The regions identified underscore the importance of pathways influencing pancreatic beta cell development and function in the etiology of type 2 diabetes.
Figures
References
-
- Stumvoll M, Goldstein BJ, van Haeften TW. Lancet. 2005;365:1333–1346. - PubMed
-
- Altshuler D, et al. Nat. Genet. 2000;26:76–80. - PubMed
-
- Gloyn AL, et al. Diabetes. 2003;52:568–572. - PubMed
-
- Grant SF, et al. Nat. Genet. 2006;38:320–323. - PubMed
-
- Donnelly P, the WTCCC, personal communication Data from the Wellcome Trust Case Control Consortium scan.
Publication types
MeSH terms
Substances
Grants and funding
LinkOut - more resources
Full Text Sources
Other Literature Sources
Medical
Molecular Biology Databases
Research Materials
Miscellaneous
