. 2007 Apr 27;316(5824):608-11.
doi: 10.1126/science.1139253.

Requirement of bic/microRNA-155 for normal immune function

Affiliations

Requirement of bic/microRNA-155 for normal immune function

Antony Rodriguez et al. Science. .

Abstract

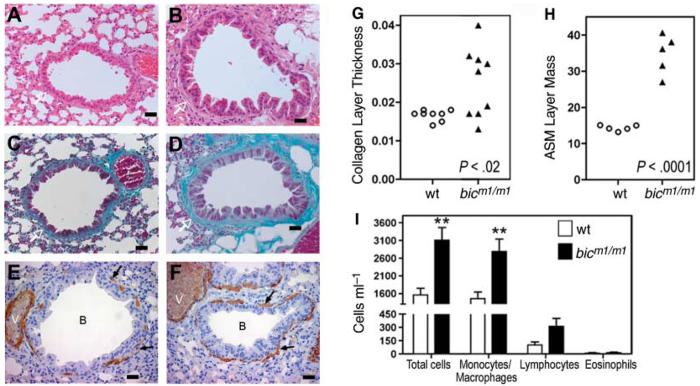
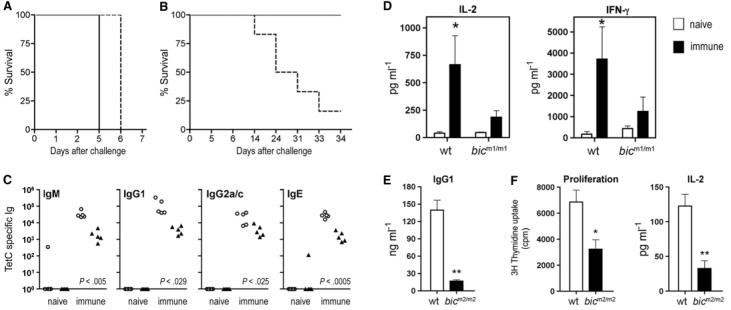
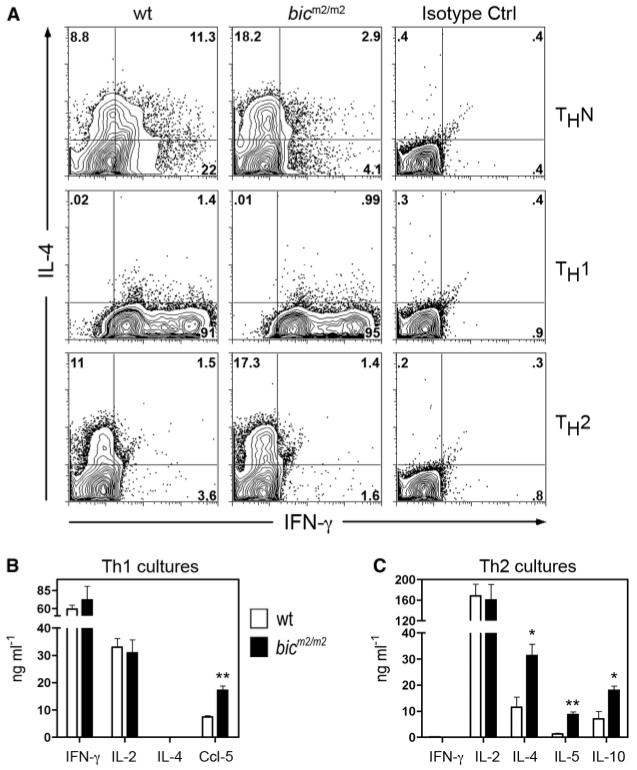
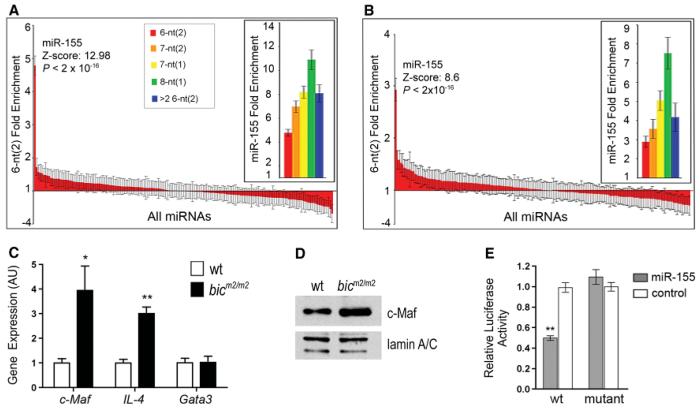
MicroRNAs are a class of small RNAs that are increasingly being recognized as important regulators of gene expression. Although hundreds of microRNAs are present in the mammalian genome, genetic studies addressing their physiological roles are at an early stage. We have shown that mice deficient for bic/microRNA-155 are immunodeficient and display increased lung airway remodeling. We demonstrate a requirement of bic/microRNA-155 for the function of B and T lymphocytes and dendritic cells. Transcriptome analysis of bic/microRNA-155-deficient CD4+ T cells identified a wide spectrum of microRNA-155-regulated genes, including cytokines, chemokines, and transcription factors. Our work suggests that bic/microRNA-155 plays a key role in the homeostasis and function of the immune system.


Figures

Fig. 1
Fig. 1
Mice deficient for bic/miR-155 show increased lung airway remodeling (A to F) Histological examination of sections of lung bronchioles from control wild-type (A, C, and E) and bicm1/m1 mice (B, D, and F). Scale bar, 100 μm. (A and B) Haematoxylin and eosin stain; (C and D) Masson Trichrome stain; (E and F) Immunohistochemical staining for smooth muscle actin. Collagen layer (white arrows), lung myofibroblasts (black arrows), bronchioles (B), and blood vessels (V) are indicated. (G) Quantitation of peribronchiolar collagen thickness or (H) airways smooth muscle cell (ASM) mass in bicm1/m1 mice compared with that of wild-type mice. (G) P < 0.02 or (H) P < 0.0001, in comparison with wild-type group, Student's two-tailed t test. Open circles, control mice; filled triangles, bicm1/m1 mice. Notably, bicm1/m1 mice with increased collagen layer thickness also had increased ASM mass. (I) Total and differential cell counts in BAL from the indicated mice. Data are the mean + SE from seven bic-deficient mice and six control mice. **P < 0.01 in comparison with wild-type group, Student's two-tailed t test.
Fig. 2
Fig. 2
Defective adaptive immunity by bic-deficient mice. (A) Survival curve for mice (n = 5 in each group) infected orally with 1 × 10⁸ colony-forming units (CFU)–virulent S. typhimurium strain SL344. As expected for mice of this genetic background, all failed to survive challenge. (B) Survival of mice (n = 6 in each group) infected intravenously with 1 × 10⁴ CFU of S. typhimurium aroA strain followed by oral challenge with S. typhimurium SL344 6 weeks after prime. In contrast with control mice, bicm2/m2 mice demonstrate reduced survival after challenge. (A and B) Line, control C57BL/6J (wild-type) mice; dashed line, N5 C57BL/6J backcross bicm2/m2 mice. (C) TetC-specific Ig levels from control mice (open circles) or bic-deficient mice (filled triangles) immunized with TetC at days 1 and 21 and analyzed 13 days after secondary immunization. P values denote significant differences; Student's two-tailed t test. (D) Production of IL-2 and IFN-γ by splenocytes isolated from wild-type or bicm1/m1-naïve mice (open bars) or immunized with TetC as in (C) (closed bars) and cultured for 48 hours in the presence of TetC. Data are the mean ± SE from four mice. *P < 0.05 versus naïve mice; Student's two-tailed t test. (E) Reduced IgG1 production by bicm2/m2 B cells cultured in the presence of LPS and IL-4 for 4 days. Data are the mean + SE from 3 mice. **P < 0.01 versus wild-type; Student's two-tailed t test. (F) Significantly reduced proliferation and IL-2 production by ovalbumin T cell receptor transgenic (OT-II) cells cultured with LPS-matured, bone marrow–derived, bic-deficient DCs in the presence of cognate (2.5 μM) ovalbumin protein. Cell proliferation was determined by [3H]-thymidine incorporation at 72 hours. IL-2 was measured from supernatants by enzyme-linked immunosorbent assay (ELISA) at 48 hours. Data are the mean + SE from five mice of each genotype. *P < 0.05 versus wild-type; Student's two-tailed t test.
Fig. 3
Fig. 3
Increased Th2 polarization and amplified Th2 cytokine production by bic-deficient CD4+ T cells. CD4+CD62L+ cells of indicated genotypes were cultured under (A, middle panel, and B) Th1 conditions, (A, lower panel, and C) Th2 in vitro differentiation conditions, or (A, upper panel) nonpolarizing (ThN) conditions and restimulated with immobilized antibody to CD3 (10 μg/ml) and soluble 2 μg/ml antibody to CD28 on day 6. (A) Intracellular cytometric analysis for IFN-γ and IL-4 production (16). The panel shows a representative result of three mice of each genotype analyzed in the same experiment. Data are representative of two independent experiments (n = 3 per genotype). Numbers in each quadrant are percentages of cells of indicated phenotype. (B and C) Cytokine levels were assayed by ELISA 21 hours after restimulation of cells cultured under (B) Th1 or (C) Th2 polarizing conditions. Data are the mean + SE from three individual mice. *P < 0.05 or **P < 0.01 versus wild-type; Student's two-tailed t test.
Fig. 4
Fig. 4
miR-155 pattern sequences are enriched in the Th1 and Th2 cell up-regulated genes, and c-Maf is a bona fide target of miR-155. (A and B) Fold enrichment of 5′ miRNA pattern sequences of the indicated types contained in the 3′ UTRs of the (A) Th1 or (B) Th2 cDNA microarray significantly up-regulated gene sets. The standard deviation, Z score, and P value were calculated by sampling 1000 random sets of 53 (for Th1 set) or 99 (for Th2 set) genes from the mouse genome (16). Data are fold enrichment ± SD. (C) Quantitative PCR analysis for Gata3, c-Maf, and IL-4 transcript levels from Th2 cells re-stimulated with antibodies to CD3 and CD28. Data are the mean + SE from three mice. *P < 0.05 versus wild-type; Student's two-tailed t test. (D) c-MAF protein levels were assessed by Western blot of nuclear extracts of Th2 cells isolated from the indicated genotypes. Expression of lamin A/C was used as loading control. (E) miR-155–dependent repression of c-Maf reporter in vitro. A luciferase (Rluc) reporter was used to validate c-Maf as a direct target of miR-155. Wild-type (wt) or mutant plasmids (mut) were contransfected with the indicated duplex miRNA for miR-155 (open bars) or control Cel-miR-64 (filled bars) into HeLa S3 cells. Data are mean ± SE from three experiments. **P < 0.0001 in comparison with wild-type plasmid treated with nonspecific RNA duplex, Cel-miR-64; Student's two-tailed t test.

Comment in

References

    1. Bartel DP. Cell. 2004;116:281. - PubMed
    1. Engels BM, Hutvagner G. Oncogene. 2006;25:6163. - PubMed
    1. Griffiths-Jones S, Grocock RJ, van Dongen S, Bateman A, Enright AJ. Nucleic Acids Res. 2006;34:D140. - PMC - PubMed
    1. Muljo SA, et al. J. Exp. Med. 2005;202:261. - PMC - PubMed
    1. Cobb BS, et al. J. Exp. Med. 2006;203:2519. - PMC - PubMed

Publication types

MeSH terms