. 2007 Jul;14(7):1361-73.
doi: 10.1038/sj.cdd.4402127. Epub 2007 Apr 20.

Tumour necrosis factor-alpha inhibits adipogenesis via a beta-catenin/TCF4(TCF7L2)-dependent pathway

Affiliations

Tumour necrosis factor-alpha inhibits adipogenesis via a beta-catenin/TCF4(TCF7L2)-dependent pathway

W P Cawthorn et al. Cell Death Differ. 2007 Jul.

Abstract

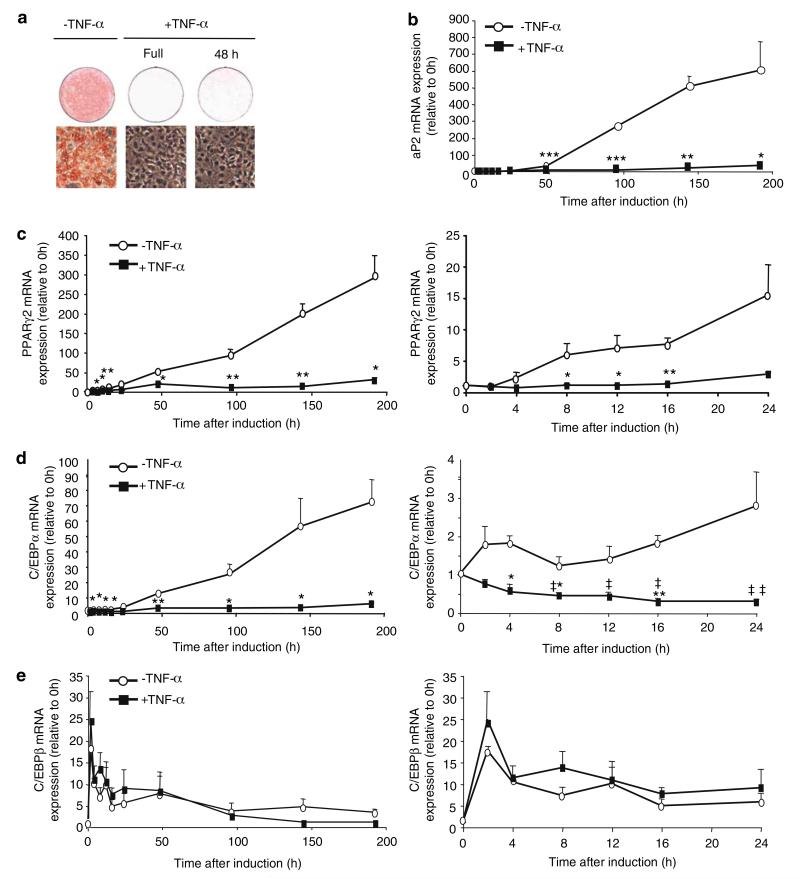
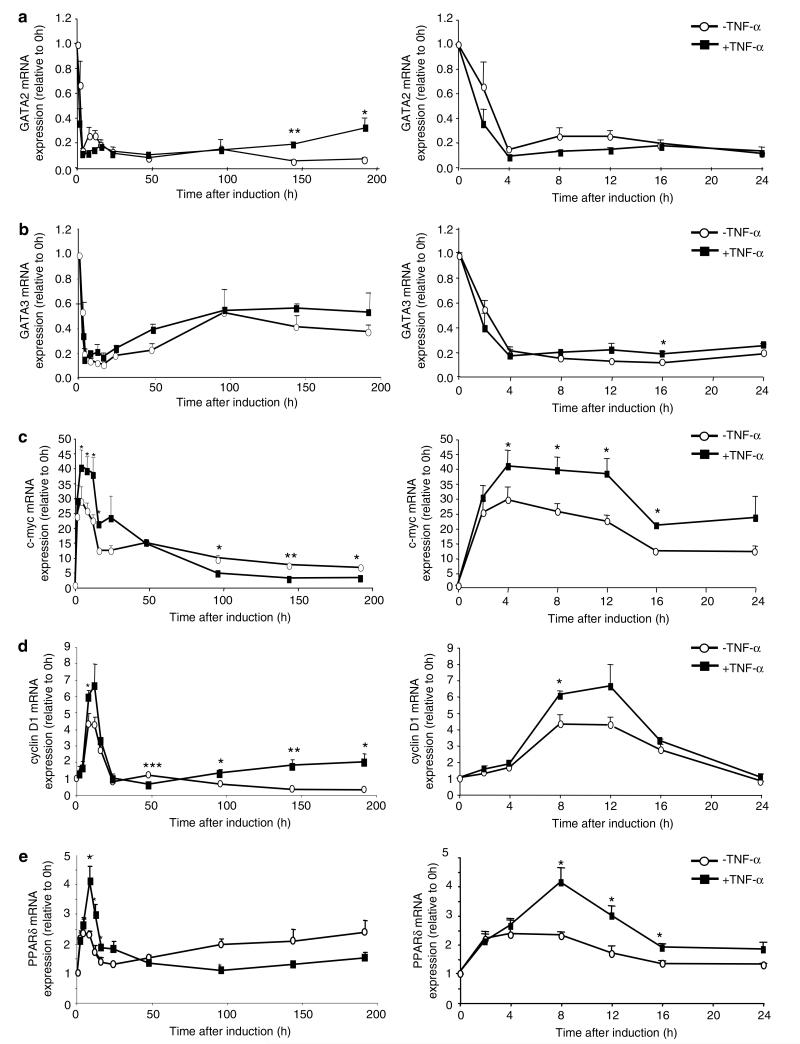
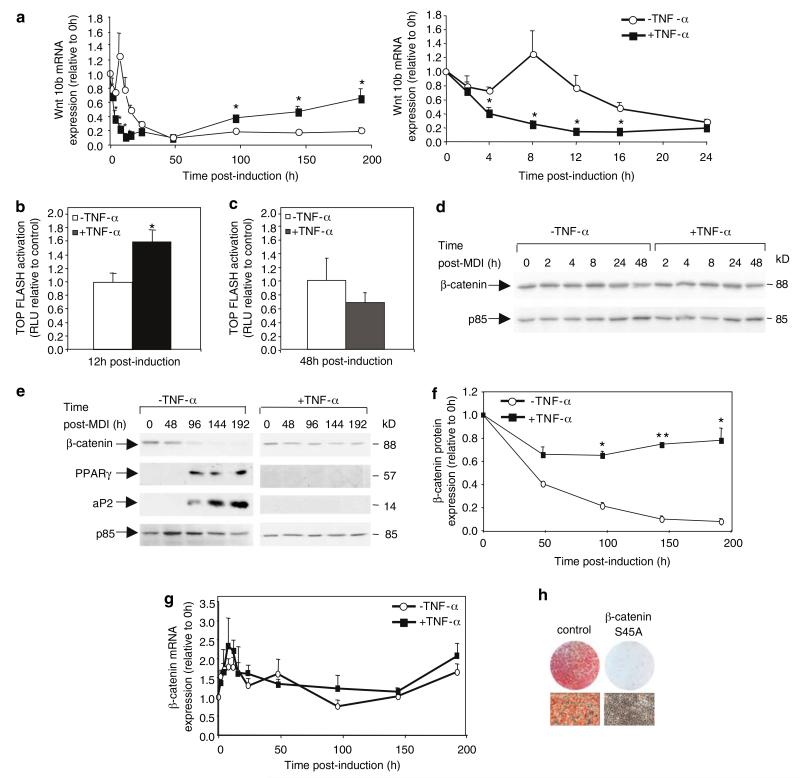
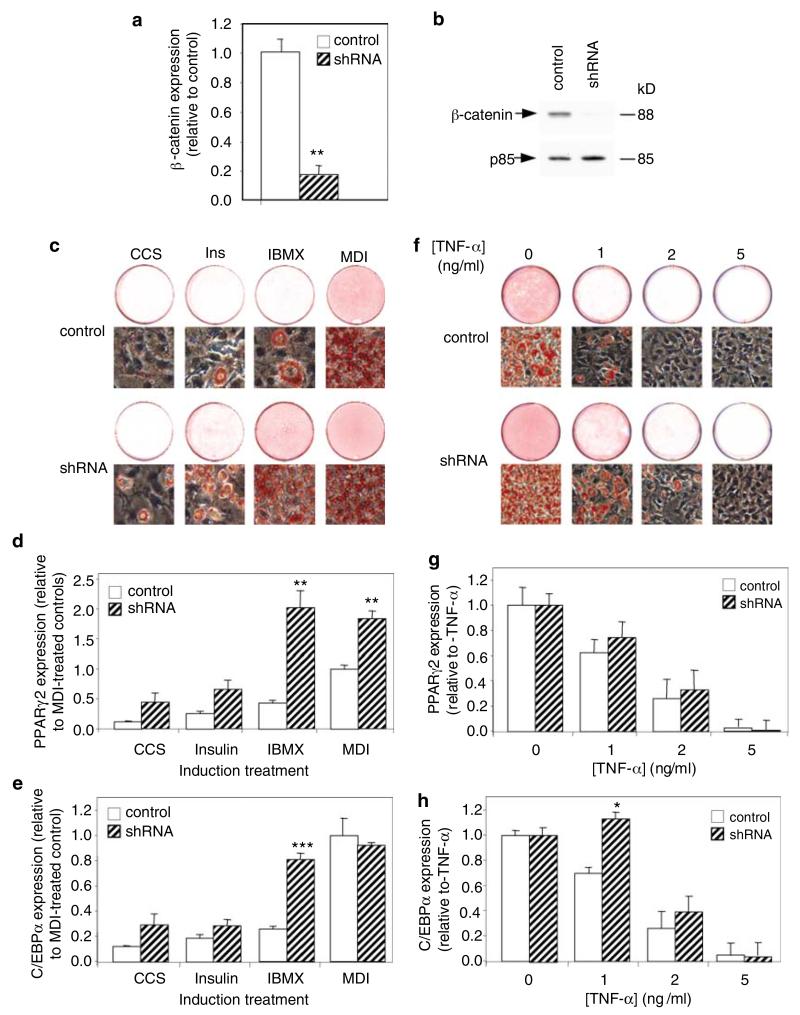
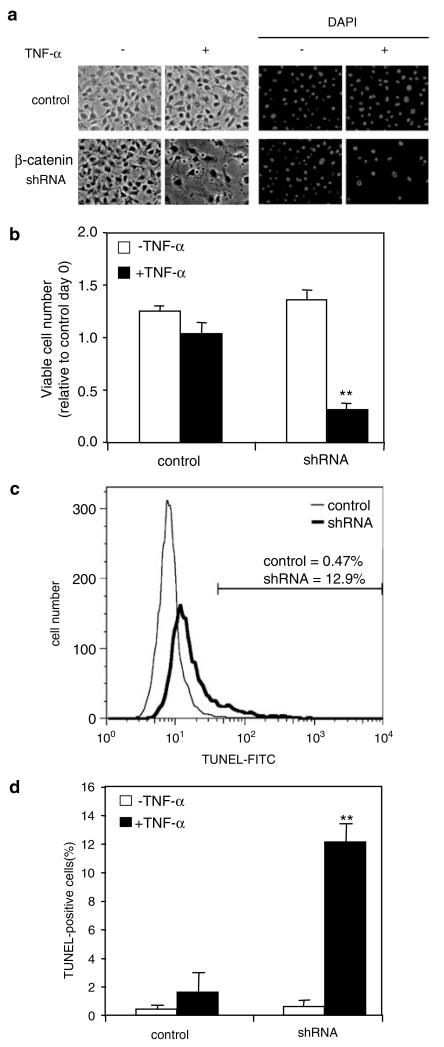
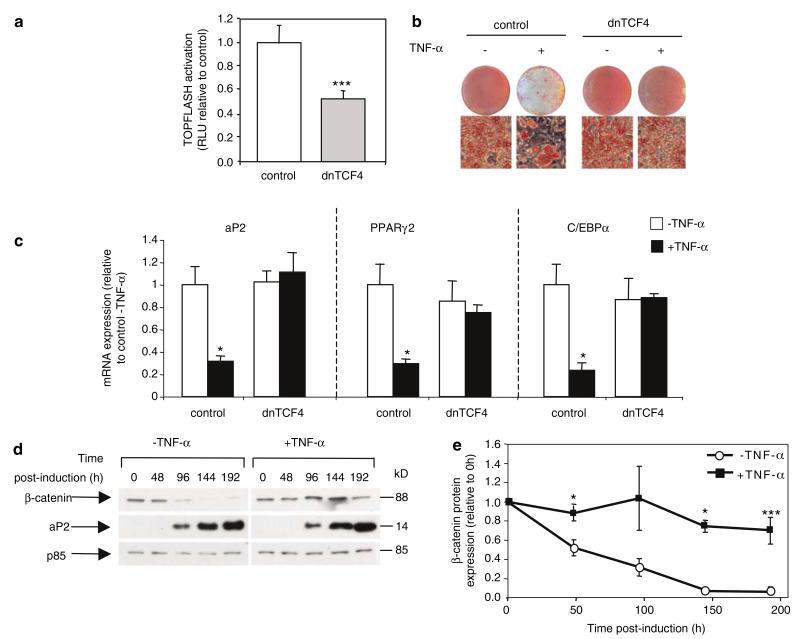
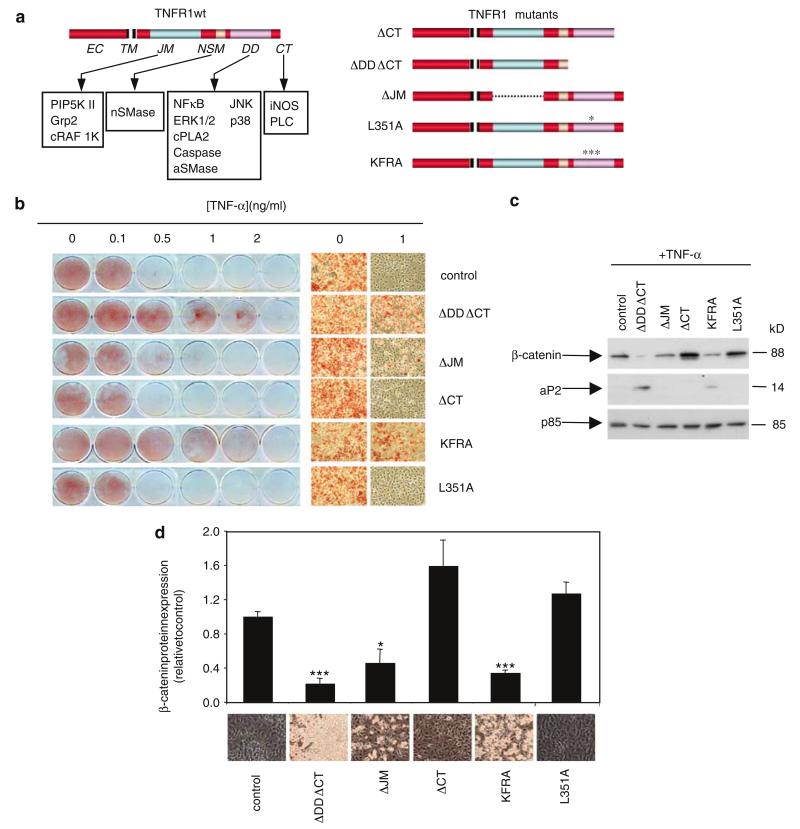
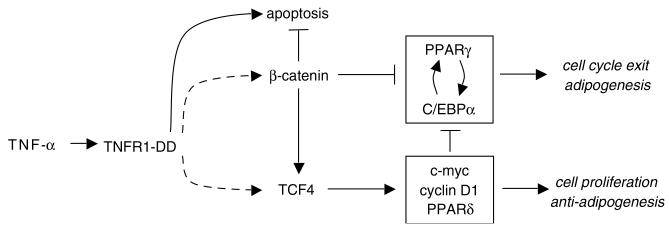
Tumour necrosis factor-alpha (TNF-alpha), a proinflammatory cytokine, is a potent negative regulator of adipocyte differentiation. However, the mechanism of TNF-alpha-mediated antiadipogenesis remains incompletely understood. In this study, we first confirm that TNF-alpha inhibits adipogenesis of 3T3-L1 preadipocytes by preventing the early induction of the adipogenic transcription factors peroxisome proliferator-activated receptor-gamma (PPARgamma) and CCAAT/enhancer binding protein-alpha (C/EBPalpha). This suppression coincides with enhanced expression of several reported mediators of antiadipogenesis that are also targets of the Wnt/beta-catenin/T-cell factor 4 (TCF4) pathway. Indeed, we found that TNF-alpha enhanced TCF4-dependent transcriptional activity during early antiadipogenesis, and promoted the stabilisation of beta-catenin throughout antiadipogenesis. We analysed the effect of TNF-alpha on adipogenesis in 3T3-L1 cells in which beta-catenin/TCF signalling was impaired, either via stable knockdown of beta-catenin, or by overexpression of dominant-negative TCF4 (dnTCF4). The knockdown of beta-catenin enhanced the adipogenic potential of 3T3-L1 preadipocytes and attenuated TNF-alpha-induced antiadipogenesis. However, beta-catenin knockdown also promoted TNF-alpha-induced apoptosis in these cells. In contrast, overexpression of dnTCF4 prevented TNF-alpha-induced antiadipogenesis but showed no apparent effect on cell survival. Finally, we show that TNF-alpha-induced antiadipogenesis and stabilisation of beta-catenin requires a functional death domain of TNF-alpha receptor 1 (TNFR1). Taken together these data suggest that TNFR1-mediated death domain signals can inhibit adipogenesis via a beta-catenin/TCF4-dependent pathway.


Figures

Figure 1
Figure 1
Short-term exposure to TNF-α is sufficient to inhibit adipogenesis in 3T3-L1 cells. Confluent 3T3-L1 preadipocytes were induced to differentiate as described in Materials and Methods. Cells were treated with or without TNF-α (2 ng/ml) either throughout the differentiation procedure (Full) or for the first 48 h after induction (48 h). (a) At 8 days post-induction, the extent of adipogenesis was assessed by staining for lipid accumulation with Oil Red O. The data are representative of five independent experiments. (b–e) 3T3-L1 cells were induced to differentiate with or without TNF-α (2 ng/ml for the first 48 h) and total RNA was extracted at 0, 2, 4, 8, 12, 16, 24, 48, 96, 144 and 192 h post-induction. Transcript levels of aP2 (b), PPARγ2 (c), C/EBPα (d) and C/EBPβ (e) were determined by using real-time PCR and normalised to 18S rRNA. Gene expression is reported relative to levels at 0 h as mean±S.E.M. of three independent experiments. Statistical significance is indicated as follows: Compared to control treatment at the same time point (*P<0.05; **P<0.01; ***P<0.001); TNF treatment compared to time 0 (‡ = P<0.05; ‡‡ = P<0.01)
Figure 2
Figure 2
Effect of TNF-α treatment on the expression of antiadipogenic mediators during the early stages of antiadipogenesis. RNA samples were collected during 3T3-L1 adipogenesis and antiadipogenesis as described in Figure 1. Expression of GATA2 (a), GATA3 (b), c-myc (c), cyclin D1 (d) and PPARδ (e) was determined by using real-time PCR and normalised to 18S rRNA. Gene expression and statistically significant differences are reported as described in Figure 1
Figure 3
Figure 3
TNF-α activates β-catenin/TCF signalling during early antiadipogenesis. Expression of Wnt10b (a) was determined as described in Figures 1 and 2. (b and c) 3T3-L1 preadipocytes were also transfected with the TCF reporter Topflash as described in Materials and Methods. Three days post-transfection, cells were induced to differentiate in the absence or presence of TNF-α (2 ng/ml). Luciferase activity was assayed 12 h (b) or 48 h (c) post-induction. The results are reported relative to luciferase activity in the absence of TNF-α as mean±S.E.M. of five (b) or four (c) independent experiments, with each experiment carried out in duplicate. (d, e and f) Confluent 3T3-L1 preadipocytes were induced to differentiate with or without TNF-α (for the first 48 h after induction) and cytosolic protein was extracted at the indicated times post-induction. Expression of β-catenin, aP2, and PPARγ was then analysed by Western blotting. Time 0 h proteins were extracted before differentiation was induced. The p85 subunit of PI3K was used as a loading control. Quantification of β-catenin levels from (e) by densitometrical analysis and normalisation to p85 levels is shown in (f) and is expressed as mean±S.E.M. of three independent experiments. (g) β-catenin mRNA expression during adipogenesis and TNF-α-induced antiadipogenesis. Total RNA was extracted as described in Figure 1. (h) 3T3-L1 preadipocytes expressing β-catenin S45A or an empty vector were induced to differentiate with MDI. The extent of adipogenesis at 8 days post-induction was assessed by staining for lipid accumulation with oil red O
Figure 4
Figure 4
Knockdown of β-catenin enhances adipogenesis in 3T3-L1 preadipocytes and attenuates TNF-α-induced antiadipogenesis. 3T3-L1 preadipocytes were transfected with vectors encoding shRNAs against firefly luciferase (control) or murine β-catenin (shRNA). (a) Total RNA was extracted from confluent control and β-catenin shRNA 3T3-L1 preadipocytes and expression of β-catenin mRNA was determined by using real-time PCR and normalised to 18S rRNA. (b) Cytosolic protein was extracted from confluent 3T3-L1 preadipocytes expressing control or β-catenin shRNA and expression of β-catenin protein was analysed by Western blotting. p85 was used as a loading control. The result shown is representative of four independent experiments. (c–e) Control and β-catenin shRNA cells were induced to differentiate with serum only (cosmic calf serum – CCS), insulin (Ins), IBMX or MDI. The extent of adipogenesis at 8 days post-induction was assessed by oil red O staining (c) or extraction of total RNA followed by real-time PCR analysis of PPARγ2 (d) and C/EBPα (e) mRNA expression. (f–h) Control and β-catenin shRNA cells were induced to differentiate with MDI in the presence of the indicated concentrations of TNF-α, which were maintained in the adipogenic media for the first 48 h post-induction only. The extent of adipogenesis at 8 days post-induction was assessed by oil red O staining (f) or extraction of total RNA followed by real-time PCR analysis of PPARγ2 (g) and C/EBPα (h) mRNA expression. Results in (a), (d) and (e), (g) and (h) are reported relative to levels in control cells as mean±S.E.M. of three independent experiments. The results in (c) and (f) are representative of three independent experiments. For each induction treatment, statistically significant differences between control and β-catenin knockdown cells are reported as follows: *P<0.05; **P<0.01; ***P<0.001
Figure 5
Figure 5
Knockdown of β-catenin promotes apoptosis during TNF-α-induced antiadipogenesis. Control and β-catenin shRNA 3T3-L1 preadipocytes were induced to differentiate with or without TNF-α (2 ng/ml). At 0 h and 24 h post-induction, cells were either fixed and stained with DAPI and analysed by fluorescence microscopy, or analysed for DNA fragmentation by TUNEL. (a) Micrographs of cells at 24 h post-induction. (b) Quantification of viable, adherent cell number as indicated by DAPI staining of adherent cells. (c) Flow cytometric analysis of TUNEL staining in control and β-catenin shRNA 3T3-L1 cells at 24 h post-induction in the presence of TNF-α. Shown is a representative histogram. (d) The percentage of TUNEL-positive cells (indicated in (c)) as assessed by FACS analysis. The results in (a) and (c) are representative of three independent experiments. The results in (b) and (d) are expressed as mean±S.E.M. of three independent experiments. Statistically significant differences between −TNF-α and +TNF-α samples are reported as described for Figure 1
Figure 6
Figure 6
DnTCF4 reverses TNF-α-induced antiadipogenesis but not TNF-α-induced stabilisation of β-catenin. (a) 3T3-L1 preadipocytes expressing dnTCF4 or a control vector were transfected with the TCF reporter Topflash as described in Materials and Methods. Three days post-transfection, cells were induced to differentiate and luciferase activity was assayed at 12 h post-induction. The results are reported relative to those in control cells as mean±S.E.M. of two independent experiments, with each experiment done in triplicate. (b–e) Control and dnTCF4 cells were induced to differentiate in the absence or presence of TNF-α (1 ng/ml). (b) Oil red O-stained cells at 8-days post-induction of differentiation. (c) Total RNA was extracted at 8 days post-induction and the expression of aP2, PPARγ2 and C/EBPα mRNA was analysed by real-time PCR and normalised to 18S rRNA. (d) Cytosolic protein was extracted at the indicated times post-induction. Expression of β-catenin and aP2 was then analysed by Western blotting. Time 0 h proteins were extracted before differentiation was induced. p85 was used as a loading control. (e) Quantification of β-catenin levels from (d) by densitometrical analysis and normalisation to p85 levels to correct for variations in loading protein concentration. The results in (b) and (d) are representative of three independent experiments. The results in (c) and (e) are reported as mean±S.E.M. of three independent experiments. Statistically significant differences between −TNF-α and +TNF-α samples are reported as described in Figure 1
Figure 7
Figure 7
A functional death domain of TNFR1 is required for antiadipogenesis and β-catenin stabilisation by TNF-α. (a) Schematic representation of the domains of TNFR1, the signalling pathways activated via these domains and the alterations of these domains in each TNFR1 mutant (as described in Materials and Methods). (b) 3T3-L1 preadipocytes overexpressing TNFR1 mutants or an empty vector control were induced to differentiate in the absence or presence of TNF-α, as indicated. The extent of differentiation at 10 days post-induction was assessed by oil red O staining. Plates of cells (35 mm) and micrographs are shown. (c) Western blots showing the expression of β-catenin and aP2 at 8 days post-induction of adipogenesis in the presence of 2 ng/ml TNF-α. p85 was used as a loading control. The results in (b) and (c) are representative of three independent experiments. (d) Quantification of β-catenin levels from (c) by densitometrical analysis and normalisation to p85 levels to correct for variations in loading protein concentration. Representative micrographs of unstained cells are shown below the graph for each cell type. The results are reported as mean±S.E.M. of three independent experiments. Statistically significant differences between control and TNFR1 mutant-overexpressing cells are reported as follows: *P<0.05; **P<0.01; ***P<0.001
Figure 8
Figure 8
Proposed mechanism of TNF-α-induced antiadipogenesis. TNF-α activates TNFR1, causing signals to be transduced via the death domain. These signals promote the stabilisation of β-catenin, which inhibits PPARγ activity by binding directly to PPARγ protein. TNF-α also activates expression of β-catenin/TCF4 target genes, either directly, or by promoting the transactivation of TCF4 by β-catenin. This enhances the expression of antiadipogenic, proproliferative genes, which inhibit adipogenesis by suppressing the expression and activity of PPARγ and C/EBPα. Hence, these TNFR1-DD-derived signals result in suppression of the early induction of PPARγ and C/EBPα, thereby preventing adipogenesisis

References

    1. Farmer SR. Transcriptional control of adipocyte formation. Cell Metab. 2006;4:263–273. - PMC - PubMed
    1. MacDougald OA, Mandrup S. Adipogenesis: forces that tip the scales. Trends Endocrinol Metab. 2002;13:5–11. - PubMed
    1. Ross SE, Hemati N, Longo KA, Bennett CN, Lucas PC, Erickson RL, et al. Inhibition of adipogenesis by Wnt signaling. Science. 2000;289:950–953. - PubMed
    1. Xu H, Sethi JK, Hotamisligil GS. Transmembrane tumor necrosis factor (TNF)-alpha inhibits adipocyte differentiation by selectively activating TNF receptor 1. J Biol Chem. 1999;274:26287–26295. - PubMed
    1. Huelsken J, Behrens J. The Wnt signalling pathway. J Cell Sci. 2002;115:3977–3978. - PubMed

Publication types

MeSH terms

LinkOut - more resources