The effects of reinforcer magnitude on timing in rats
- PMID: 17465312
- PMCID: PMC1832167
- DOI: 10.1901/jeab.2007.38-06
The effects of reinforcer magnitude on timing in rats
Abstract
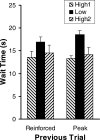
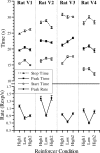
The relation between reinforcer magnitude and timing behavior was studied using a peak procedure. Four rats received multiple consecutive sessions with both low and high levels of brain stimulation reward (BSR). Rats paused longer and had later start times during sessions when their responses were reinforced with low-magnitude BSR. When estimated by a symmetric Gaussian function, peak times also were earlier; when estimated by a better-fitting asymmetric Gaussian function or by analyzing individual trials, however, these peak-time changes were determined to reflect a mixture of large effects of BSR on start times and no effect on stop times. These results pose a significant dilemma for three major theories of timing (SET, MTS, and BeT), which all predict no effects for chronic manipulations of reinforcer magnitude. We conclude that increased reinforcer magnitude influences timing in two ways: through larger immediate after-effects that delay responding and through anticipatory effects that elicit earlier responding.
Figures


Similar articles
-
Differential responding for brain stimulation reward and sucrose in high-alcohol-drinking (HAD) and low-alcohol-drinking (LAD) rats.Alcohol Clin Exp Res. 2003 Jun;27(6):926-36. doi: 10.1097/01.ALC.0000071920.53470.C1. Alcohol Clin Exp Res. 2003. PMID: 12824813
-
Brain Stimulation Reward Supports More Consistent and Accurate Rodent Decision-Making than Food Reward.eNeuro. 2017 May 1;4(2):ENEURO.0015-17.2017. doi: 10.1523/ENEURO.0015-17.2017. eCollection 2017 Mar-Apr. eNeuro. 2017. PMID: 28466068 Free PMC article.
-
Assessing behavioral control across reinforcer solutions on a fixed-ratio schedule of reinforcement in rats.Alcohol. 2014 Jun;48(4):337-44. doi: 10.1016/j.alcohol.2013.12.006. Epub 2014 Feb 28. Alcohol. 2014. PMID: 24680666 Free PMC article.
-
Increased generalization in a peak procedure after delayed reinforcement.Behav Processes. 2019 Dec;169:103978. doi: 10.1016/j.beproc.2019.103978. Epub 2019 Sep 30. Behav Processes. 2019. PMID: 31580905
-
Brain stimulation reward performance and sucrose maintained behaviors in alcohol-preferring and -nonpreferring rats.Alcohol Clin Exp Res. 2005 Apr;29(4):571-83. doi: 10.1097/01.alc.0000158934.50534.b7. Alcohol Clin Exp Res. 2005. PMID: 15834222
Cited by
-
Revisiting the effect of nicotine on interval timing.Behav Brain Res. 2015 Apr 15;283:238-50. doi: 10.1016/j.bbr.2015.01.027. Epub 2015 Jan 29. Behav Brain Res. 2015. PMID: 25637907 Free PMC article.
-
Trial frequency effects in human temporal bisection: implications for theories of timing.Behav Processes. 2014 Jan;101:81-8. doi: 10.1016/j.beproc.2013.07.023. Epub 2013 Sep 9. Behav Processes. 2014. PMID: 24029016 Free PMC article. Clinical Trial.
-
Differential reinforcement of low rates differentially decreased timing precision.Behav Processes. 2018 Jun;151:111-118. doi: 10.1016/j.beproc.2018.02.022. Epub 2018 Mar 30. Behav Processes. 2018. PMID: 29608943 Free PMC article.
-
Neurocomputational Models of Interval Timing: Seeing the Forest for the Trees.Adv Exp Med Biol. 2024;1455:51-78. doi: 10.1007/978-3-031-60183-5_4. Adv Exp Med Biol. 2024. PMID: 38918346 Review.
-
Temporal prediction error triggers amygdala-dependent memory updating in appetitive operant conditioning in rats.Front Behav Neurosci. 2023 Jan 10;16:1060587. doi: 10.3389/fnbeh.2022.1060587. eCollection 2022. Front Behav Neurosci. 2023. PMID: 36703723 Free PMC article.
References
-
- Akaike H. A new look at the statistical model identification. IEEE Transactions on Automatic Control. 1974;19:716–723.
-
- Bizo L.A, White K.G. Pacemaker rate in the behavioral theory of timing. Journal of Experimental Psychology: Animal Behavior Processes. 1994;20:308–321.
-
- Blomeley F.J, Lowe C.F, Wearden J.H. Reinforcer concentration effects on a fixed-interval schedule. Behavioural Processes. 2004;67:55–66. - PubMed
-
- Bonem M, Crossman E.K. Elucidating the effects of reinforcement magnitude. Psychological Bulletin. 1988;104:348–362. - PubMed
-
- Buhusi C.V, Meck W.H. Differential effects of methamphetamine and haloperidol on the control of an internal clock. Behavioral Neuroscience. 2002;116:291–297. - PubMed
Publication types
MeSH terms
LinkOut - more resources
Full Text Sources

