. 2007 Mar;87(2):241-60.
doi: 10.1901/jeab.2007.13-06.

Local effects of delayed food

Affiliations

Local effects of delayed food

Michael Davison et al. J Exp Anal Behav. 2007 Mar.

Abstract

Five pigeons were trained on a procedure in which seven concurrent variable-interval schedules arranged seven different food-rate ratios in random sequence in each session. Each of these components lasted for 10 response-produced food deliveries, and components were separated by 10-s blackouts. We varied delays to food (signaled by blackout) between the two response alternatives in an experiment with three phases: In Phase 1, the delay on one alternative was 0 s, and the other was varied between 0 and 8 s; in Phase 2, both delays were equal and were varied from 0 to 4 s; in Phase 3, the two delays summed to 8 s, and each was varied from 1 to 7 s. The results showed that increasing delay affected local choice, measured by a pulse in preference, in the same way as decreasing magnitude, but we found also that increasing the delay at the other alternative increased local preference. This result casts doubt on the traditional view that a reinforcer strengthens a response depending only on the reinforcer's value discounted by any response-reinforcer delay. The results suggest that food guides, rather than strengthens, behavior.


Figures
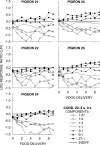
Fig A1
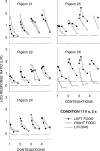
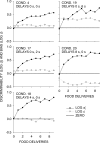
Fig A1. Condition 20.
Log Left/Right response ratios in each of the seven components as a function of increasing numbers of component food deliveries for individual pigeons (cf. Figure 1). The dotted line represents indifference (equal choice).
Fig A2
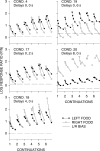
Fig A2. Phase 1 Condition 17.
Individual-pigeon log response ratios to the just-productive alternative (P/N) following food on the left and right keys, and overall log Left/Right response ratios, in each condition (cf. Figure 6). Each successive plot on a graph shows response ratios after 1, 2, 3, etc. successive food deliveries from the same alternative. The dashed line represents the overall Left/Right bias in each condition.
Fig A3
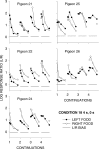
Fig A3. Phase 1 Condition 18.
Individual-pigeon log response ratios to the just-productive alternative (P/N) following food on the left and right keys, and overall log Left/Right response ratios, in each condition (cf. Figure 6). Each successive plot on a graph shows response ratios after 1, 2, 3, etc. successive food deliveries from the same alternative. The dashed line represents the overall Left/Right bias in each condition.
Fig 1
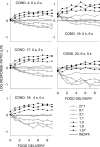
Fig 1. Phase 1.
Log Left/Right response ratios in each of the seven components as a function of increasing numbers of component food deliveries. The data were grouped over the 5 pigeons. The dotted line represents indifference (equal choice). Appendix Figure A1 shows individual-pigeon results from Condition 20.
Fig 2
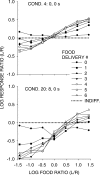
Fig 2. Log Left/Right response ratios in Conditions 4 and 20 as a function of log food ratios for up to six component food deliveries.
The dotted line represents indifference (equal choice).
Fig 3
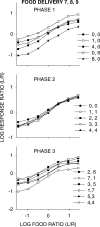
Fig 3. Group choice as a function of relative food from the last three food deliveries in components.
Log Left/Right response ratio as a function of log food ratio (varied within sessions) for each pair of delays (varied between conditions) in all phases of the present experiment.
Fig 4
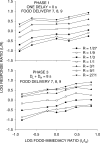
Fig 4. Phases 1 and 3.
Group choice as a function of relative delay from the last three food deliveries in components. Log Left/Right response ratio as a function of the Left/Right immediacy ratio (varied over conditions) according to the log food ratio (varied within sessions). Because the pigeons took an unknown time greater than 0 s to reach the food magazine, the preferences shown in the upper graph (Phase 1) have ordinal significance only, and the shapes of the functions are arbitrary. In Phase 3 (lower graph), the minimum delay was 1 s, presumably longer than the time pigeons took to move to the food magazine.
Fig 5
Fig 5. Phase 1.
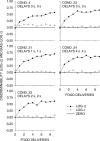
Response–food discriminability (dr) and bias (log c) using Equation 2 for successive food deliveries in components. The dotted line represents zero discriminability and bias.
Fig 6
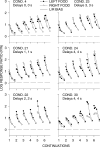
Fig 6. Phase 1.
Group log response ratios to the just-productive alternative (P/N) following food on the left and right keys, and overall log Left/Right response ratios, in each condition. The response numbers were grouped: all first responses, then second and third responses, then Responses 4 through 7, then Responses 8 through 15, and then Responses 16 through 31. Each successive plot on a graph shows response ratios after 1, 2, 3, etc. successive food deliveries from the same alternative. The dashed line represents the overall Left/Right bias in each condition. Appendix Figure A2 shows individual-pigeon results from Condition 17 and 18.
Fig 7
Fig 7. Phase 1.
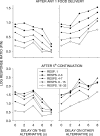
Group log response ratios to the just-productive alternative (P/N) as a function of delay (left graphs) and, for the 0-s delay alternative, as a function of delay on the other alternative (right graphs). Upper graphs show performance after any single food delivery, and lower graphs after five continued same-alternative food deliveries. Preferences are shown at selected response-number bins after food.
Fig 8
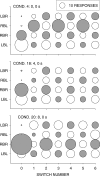
Fig 8. Phase 1, selected conditions.
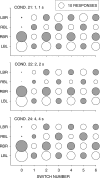
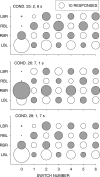
Responses per visit as a function of switch number after food delivery for all pairwise sequences of food on the left and right keys. The length of the visit is shown by the diameter of the bubble. Unfilled bubbles are left-alternative visits, and filled bubbles are right-alternative visits, respectively.
Fig 9
Fig 9. Phase 2.
Response–food discriminability (dr) and bias (log c) using Equation 2 for successive food deliveries in components. The dotted line represents zero discriminability and bias.
Fig 10
Fig 10. Phase 2.
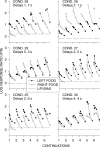
Group log response ratios to the just-productive alternative (P/N) following food on the left and right keys, and overall log Left/Right response ratios, in each condition. The response numbers were grouped: all first responses, then second and third responses, then Responses 4 through 7, then Responses 8 through 15, and then Responses 16 through 31. Each successive plot on a graph shows response ratios after 1, 2, 3, etc. successive food deliveries from the same alternative. The dashed line represents the overall Left/Right bias in each condition.
Fig 11
Fig 11. Phase 2, selected conditions.
Responses per visit as a function of switch number after food delivery for all pairwise sequences of food on the left and right keys. The length of the visit is shown by the diameter of the bubble. Unfilled bubbles are left-alternative visits, and filled bubbles are right-alternative visits, respectively.
Fig 12
Fig 12. Phase 3.
Response–food discriminability (dr), response–immediacy discriminability (di), and bias (log c) using Equation 3 for successive food deliveries in components (group data).
Fig 13
Fig 13. Phase 3.
Group log response ratios to the just-productive alternative (P/N) following food on the left and right keys, and overall log Left/Right response ratios, in each condition. The response numbers were grouped: all first responses, then second and third responses, then Responses 4 through 7, then Responses 8 through 15, and then Responses 16 through 31. Each successive plot on a graph shows response ratios after 1, 2, 3, etc. successive food deliveries from the same alternative. The dashed line represents the overall Left/Right bias in each condition.
Fig 14
Fig 14. Phase 3.
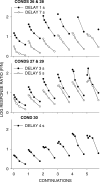
Group log response ratios to the just-productive alternative (P/N) following food on the left and right keys, and overall log Left/Right response ratios, in each condition. The data have been averaged across the same delays arranged in different conditions; for instance, the 5-s delay data from Condition 29 (left key) were averaged with the 5-s delay data from Condition 27 (right key); the data for Condition 30 (equal 4-s delays) have been averaged across the left and right alternatives. Each successive plot on a graph shows response ratios after 1, 2, 3, etc. successive food deliveries from the same alternative.
Fig 15
Fig 15. Phase 3.
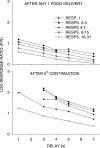
Log P/N response ratios as a function of delay duration at selected response number bins after food. The upper graph shows choice after any single food delivery, and the lower graph after five continued food deliveries on an alternative. The group data are the same as those used in Figure 14.
Fig 16
Fig 16. Phase 3, selected conditions.
Responses per visit as a function of switch number after food delivery for all pairwise sequences of food on the left and right keys. The length of the visit is shown by the diameter of the bubble. Unfilled bubbles are left-alternative visits, and filled bubbles are right-alternative visits respectively.

Similar articles

Cited by

References

    1. Alsop B, Elliffe D. Concurrent-schedule performance: Effects of relative and overall reinforcer rate. Journal of the Experimental Analysis of Behavior. 1988;49:21–36. - PMC - PubMed
    1. Aparicio C.F, Baum W.M. Fix and sample with rats in the dynamics of choice. Journal of the Experimental Analysis of Behavior. 2006;86:43–63. - PMC - PubMed
    1. Baum W.M. On two types of deviation from the matching law: Bias and undermatching. Journal of the Experimental Analysis of Behavior. 1974;22:231–242. - PMC - PubMed
    1. Baum W.M, Davison M. Choice in a variable environment: Visit patterns in the dynamics of choice. Journal of Experimental Analysis of Behavior. 2004;81:85–127. - PMC - PubMed
    1. Baum W.M, Rachlin H.C. Choice as time allocation. Journal of the Experimental Analysis of Behavior. 1969;12:861–874. - PMC - PubMed

LinkOut - more resources